Published: Nov 3, 2021 by Nia Catlin
rgat operates by reading instruction traces, converting those to a graph and then laying those graphs out into plots. The problem here is that computers can generally execute instructions faster than they can record, analyse and make fancy graphs with them.
Recording them is the first problem. Lets look at three ways you can do that.
Debug APIs
If you use the ‘Trace’ functionality in x64dbg, it will repeated step over each instruction, recording/evaluating and responding to conditions. This is great for reverse engineering small regions of code but even fully automated stepping is prohibitively slow over when executing 100’s of thousands of instructions, let alone millions. Software breakpoints and trap flags are also very commonly detected.
Branch/Processor Tracing
At the other end of the performance scale, Branch Tracing (and its full control flow variants) log control flow information directly to memory with minimal performance impact. Recent Intel processors have a feature called Intel Processor Trace that rgat doesn’t currently use because
- It rules out anyone using an AMD CPU
- It offers less control than Dynamic Binary Instrumentation (counterpoint: It’s probably less invasive, but nobody is going to struggle to detect rgat)
It may be added as an option in the future if tracing is a major bottleneck, but probably in conjunction with DBI rather than as a replacement.
Dynamic Binary Instrumentation
DBI is a happy performance middle-ground. rgat runs target binaries with Intel Pin, which injects our instrumentation tool into the created process. As new target code is executed, the tool gets offered a chance to add its own instrumentation code which records each block that executes and where control flow goes next.
The main overhead is the I/O of writing this trace data back to rgat, so we need to take some steps to reduce it.
Let’s look at a how the nestedloops32 test is instrumented.
Cylinder plot + heatmap render of the nestedloops32 test trace
The code has 4 levels of nested loops that combine to execute hundreds of millions of instructions.
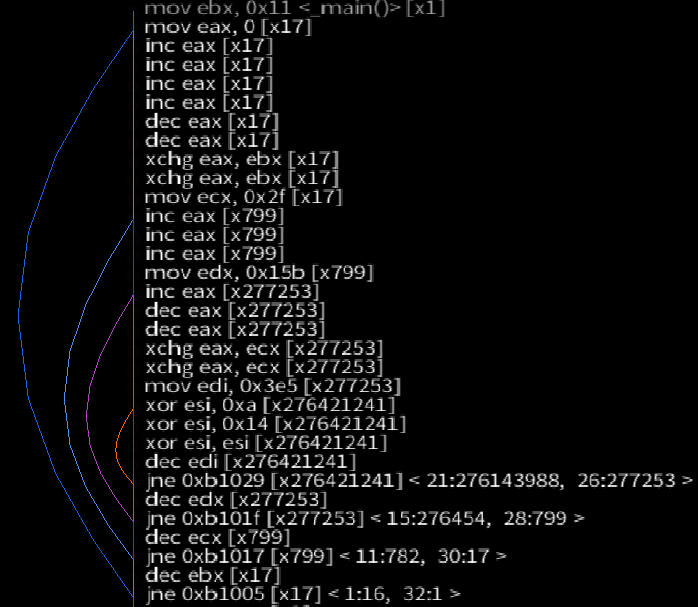
Lets start by improving on how the simplest instruction trace recorder might gather this trace, focusing on the innermost loop:
Instruction-by-instruction recording of the inner loop
Optimisation 1: Record blocks, not instructions
rgat receives the raw program code and the IDs of basic blocks in the analysis stage, before blocks are executed, so all we need to rebuild the trace is a unique ID for the block. The block ID is gathered in the instrumentation stage (ie: when it executes) at the end of the block - we also know what is going to be executed next. Now instead of recording the 5 instructions in the block 997 times, we just output 997 ‘trace tags’ consisting of the block ID and the address of the next bit of code that will be executed.
Block-by-block recording of the inner loop
Optimisation 2: Count busy blocks
Now we are outputting a single identical item, this is very easy to compress. Each block in instrumented code is assigned a counter. If the counter is incremented a certain number of times then we stop outputting trace tags until something else is executed. This partial de-instrumentation is referred to as ‘unchaining’ in the rgat codebase.
The inner loop executes 2 times normally, then a further 995 with block counting. The U,level4 tag on the third loop tells rgat that the region is busy, so it can be animated
Optimisation 3: Track busy regions
There is still more work to do to make this useful against real programs as high-cpu usage code will rarely be confined to a single basic block. In addition to tracking the execution count of each block, we can track regions of code by giving each thread an activity level.
The cliff notes version of the algorithm is:
- If a block counter is one higher than the thread counter, increment the thread counter
- If a block counter is lower than the thread counter, lower the thread counter to match
- If a block counter is more than one level higher than the thread counter, lower the block counter to match
- If increasing the thread counter takes it over the de-instrumentation limit, stop outputting tags - enter busy mode
- If decreasing the thread counter takes it under the de-instrumentation limit, output all counters - leave busy mode
This results in a kind of sliding window effect where regions of varying control flow stay quite interactive on rgat’s display, but the more time a thread spends in the region, the fewer tags are output - keeping things fairly performant.
Optimisation 4: Be lossy
One important note is that this performance comes at the cost of some precision: rgat knows how many times each block in a busy region executes, but doesn’t record the exact order they execute in - which would be a much bigger performance hit. For our use case of getting an idea of how a program is structured we don’t need to reconstruct the exact trace, so this is an ideal tradeoff.
Using a deinstrumentation limit of 10, Prgat records the whole 1.38bn instruction nestedloops32 test using 463 trace tags

Note that on the (replay) visualiser bar for this trace, the top plot shows the bulk of the programs instructions (by execution count) being recorded in a single burst at the end as the regions for all 4 loops emit their counters.