Published: Nov 14, 2021 by Nia Catlin
Software protectors can be a bit of a trial by fire for binary analysis tools - this post shows some visualisations of a few packers and protectors often used for malware. It’s intended to be a record for how rgat’s visualisation capabilities evolve - so expect the first entry to be a bit rough.
Versions are the latest demos available as of Nov 2021.
Original Binary
The visualisations below are traces of the packed ConsolePrint32 test - a tiny binary with 24 instructions and a few API calls.
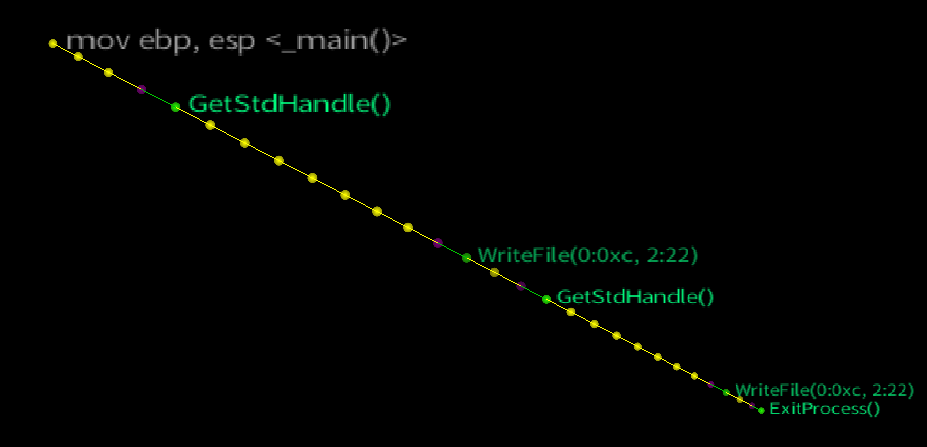 Original unpacked binary
ASPack
At under 1000 nodes (147K instructions executed), ASPacked binaries lend themselves nicely to force directed graph layout (as nicely as the originals, anyway)
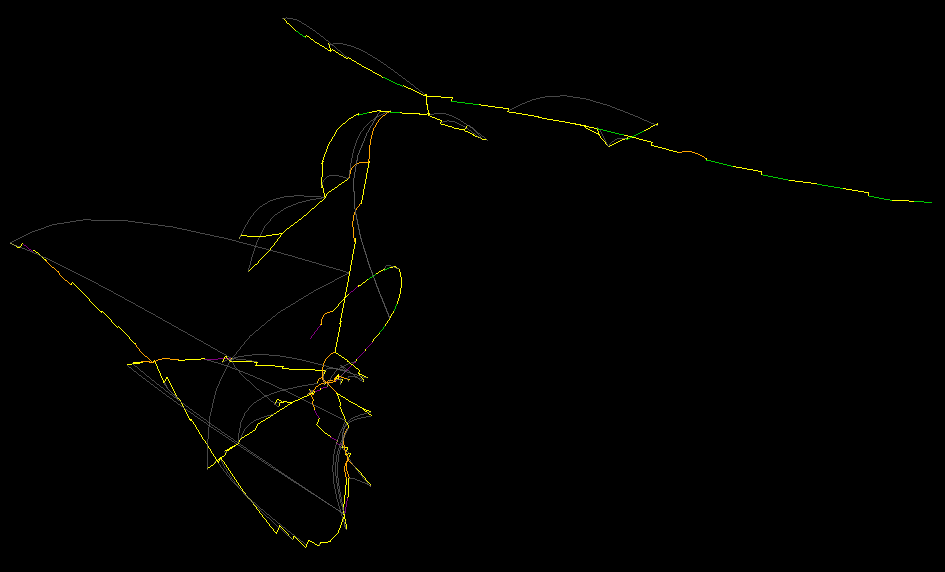 Force-directed control-flow rendering
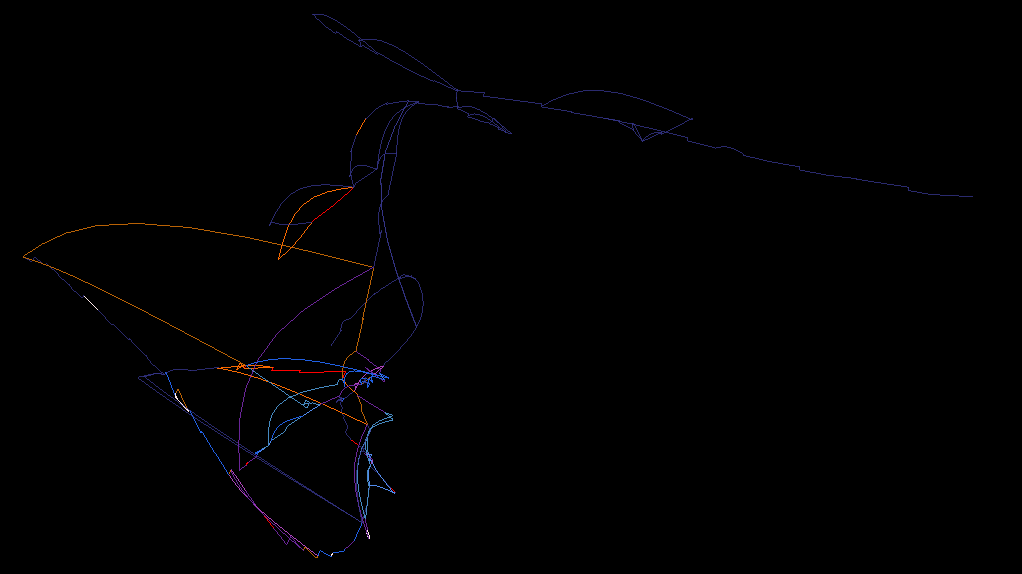 Force-directed heatmap rendering
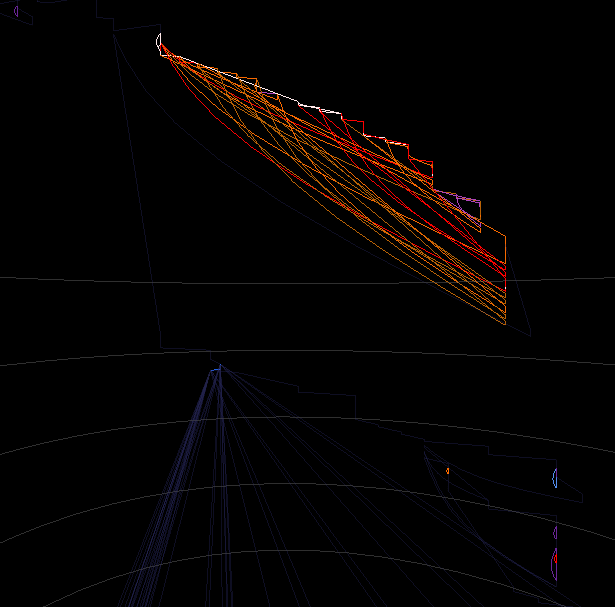
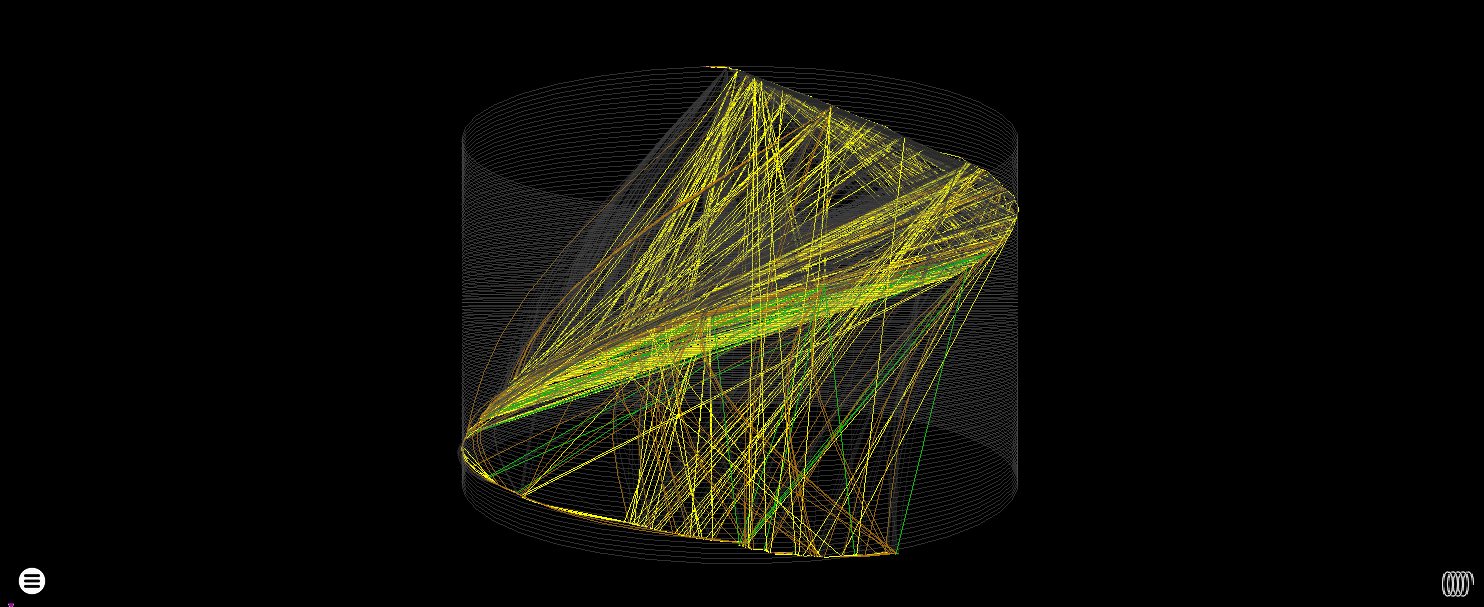
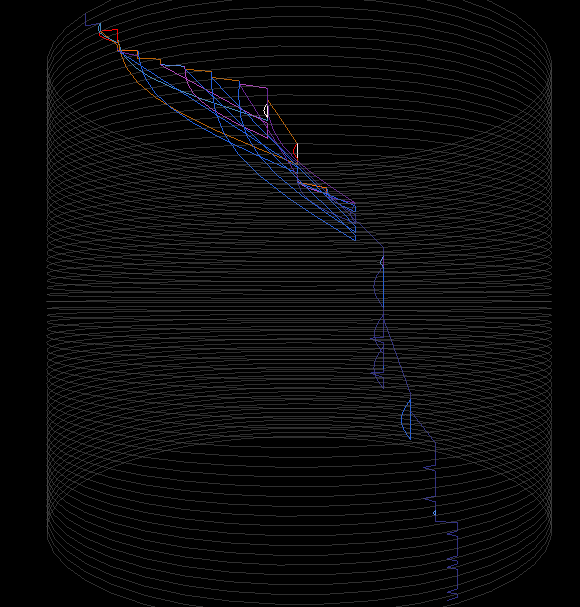
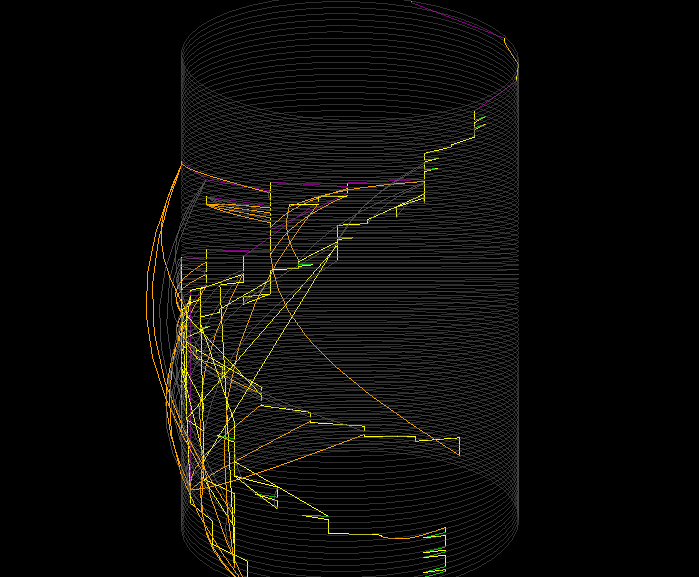 Cylinder control rendering
 Cylinder heatmap rendering
Themida 2
Main Thread
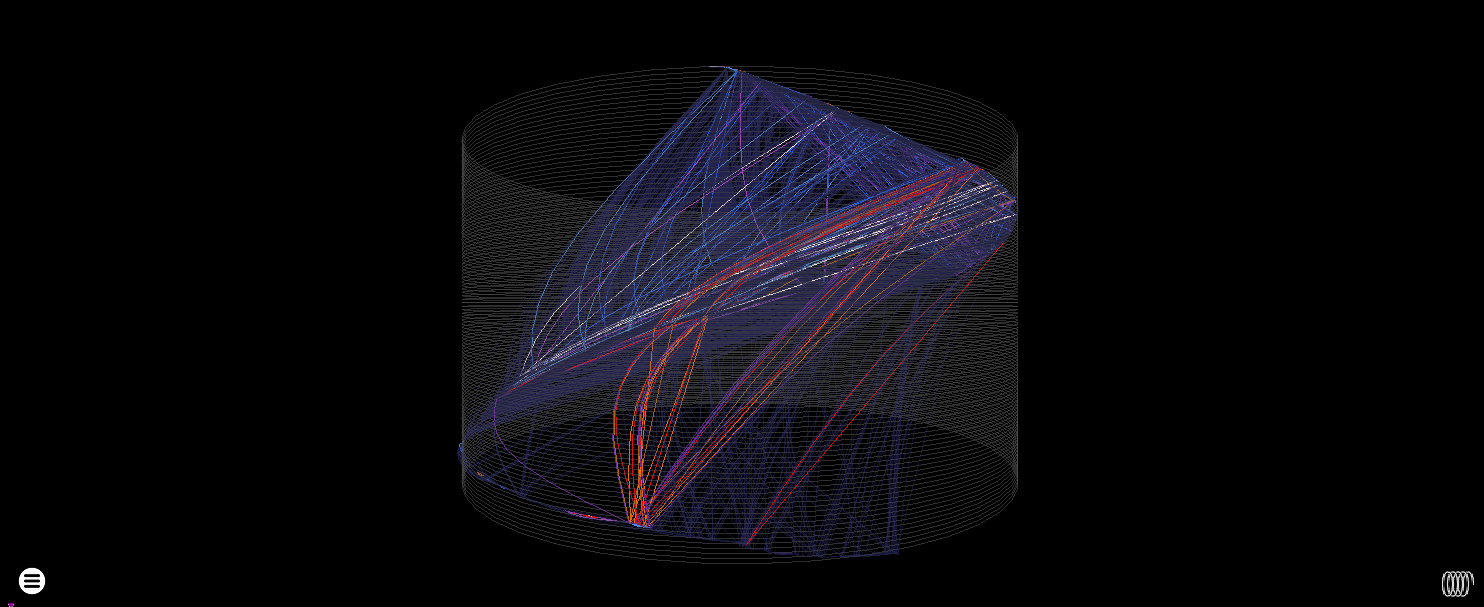
This trace consists of lots of junk-filled decryption loops interspersed with calls to the VM area. It also makes heavy use of exceptions (the cyan edges).
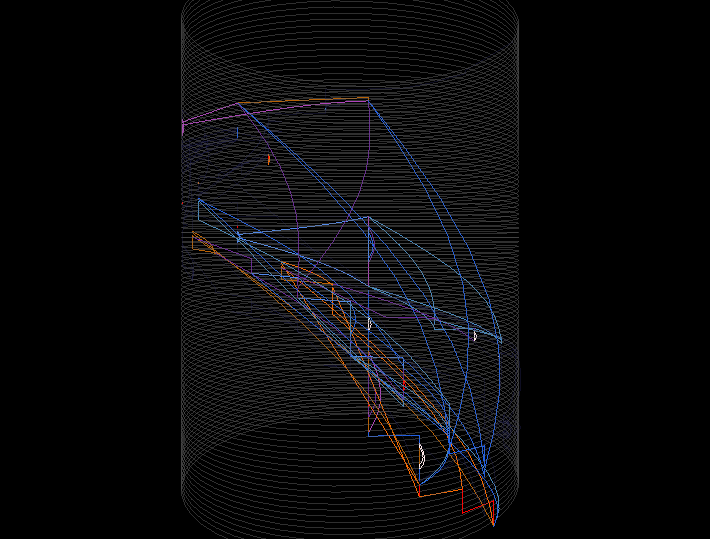
 Cylinder control-flow rendering
 Cylinder heatmap rendering
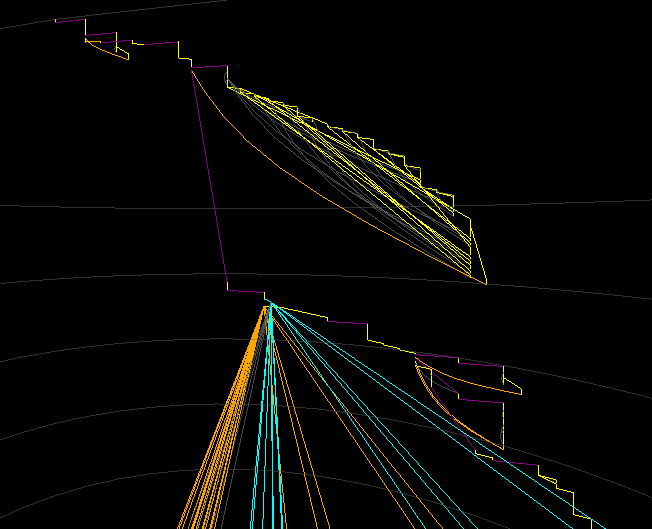 Zoomed in - the initial decryption and decompression stub, followed by the start of the obfuscated, exception-heavy control flow
 Heatmap rendering of the same area
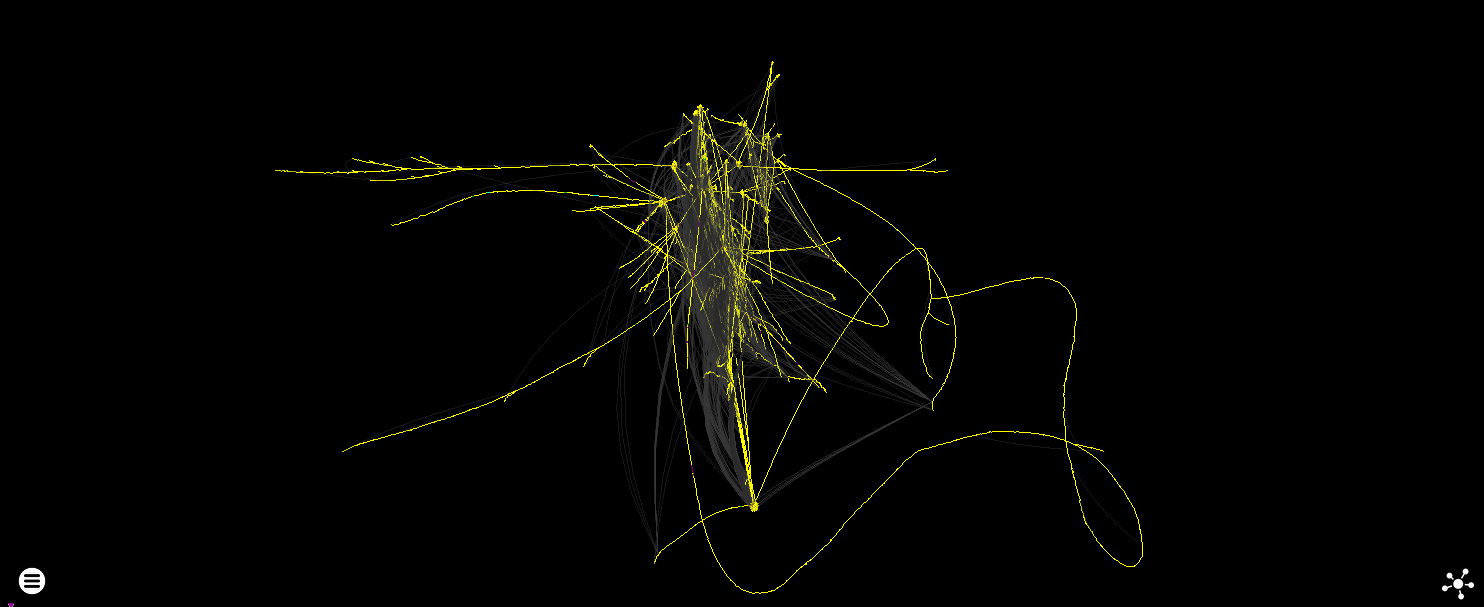
Approaching 250M instructions executed (around 200K unique), this type of layout is a bit of a stretch for the force directed algorithm - both in terms of performance and how useful the layout is.
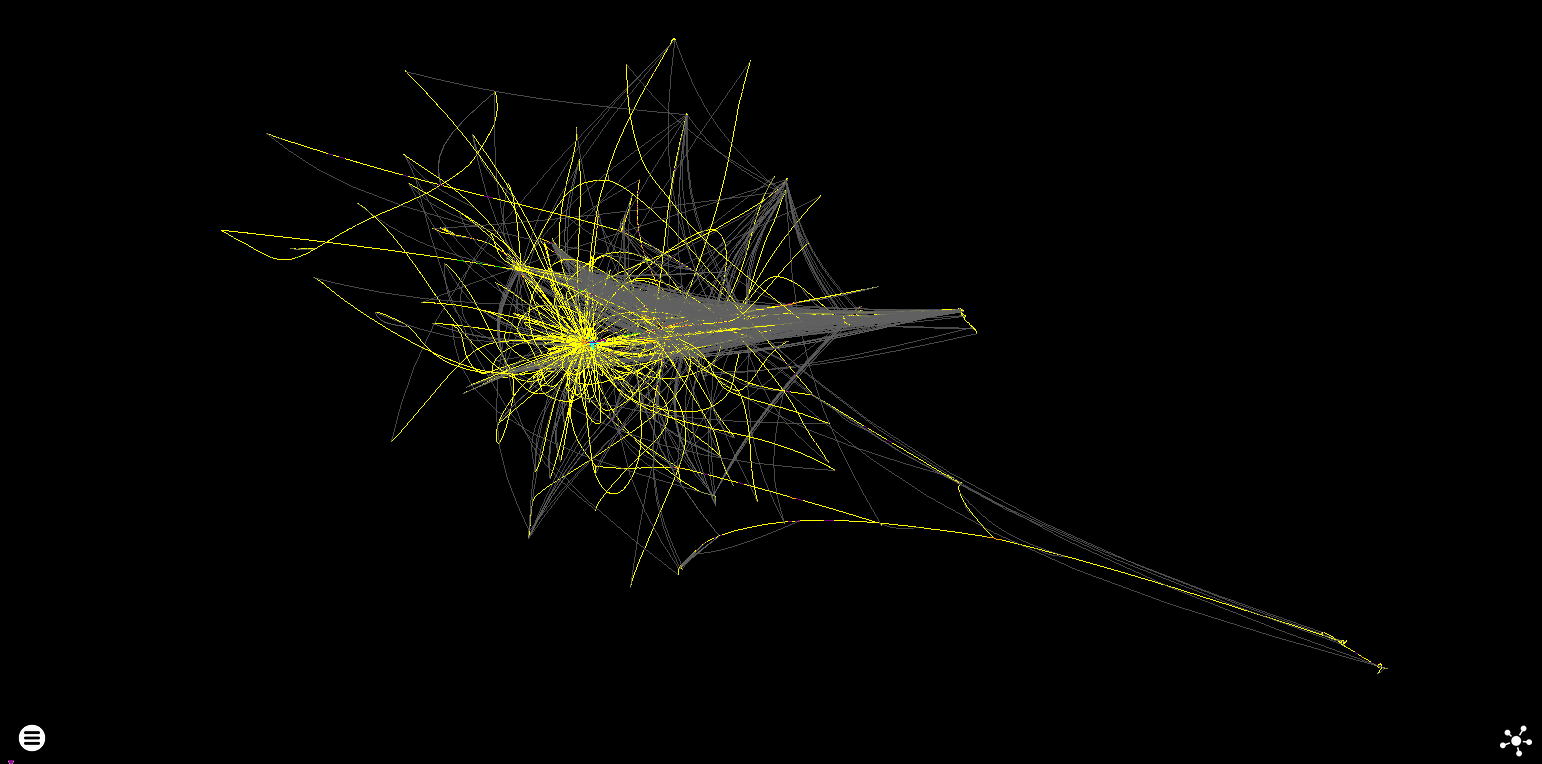 Force directed block control flow
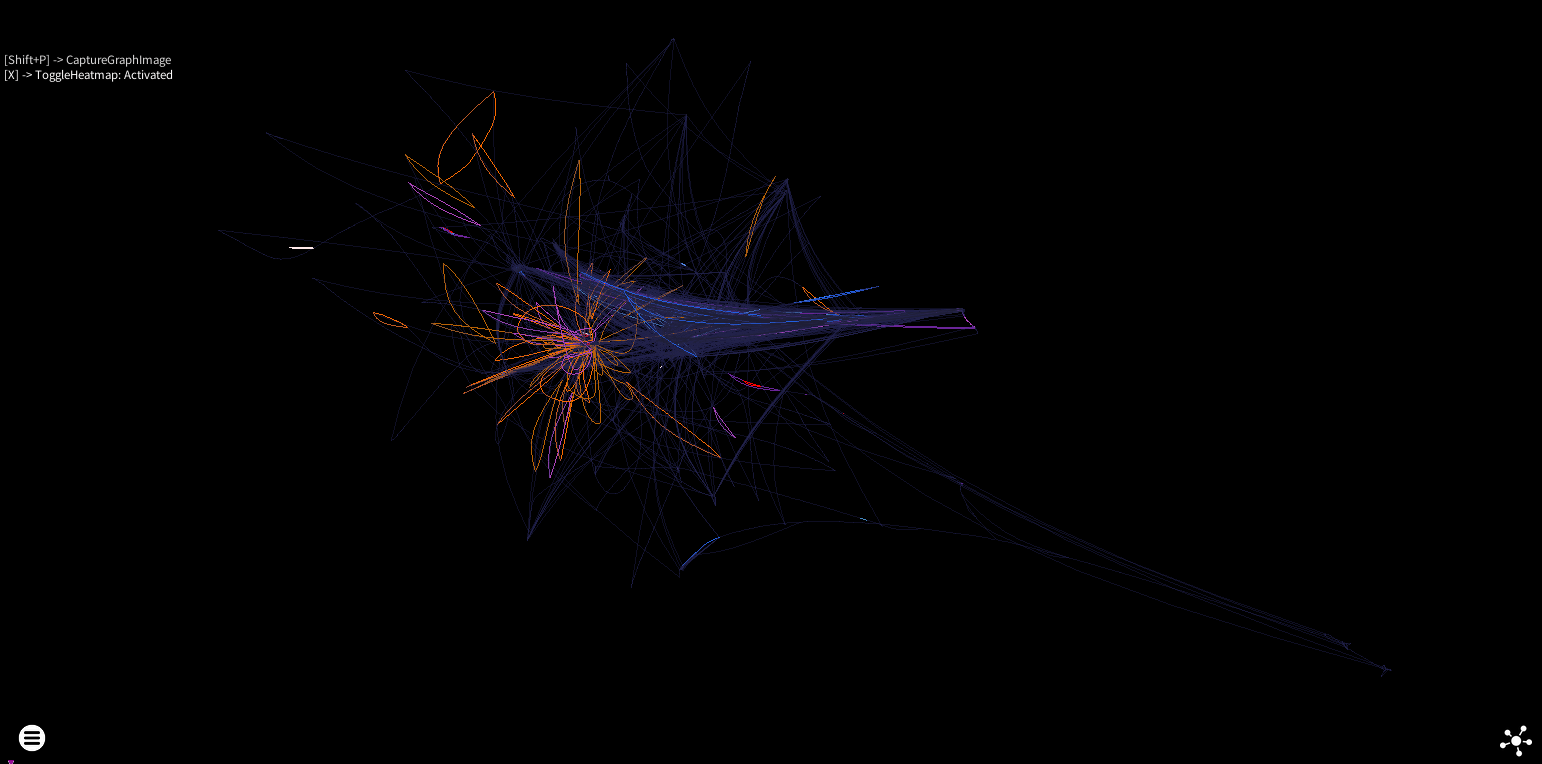 Force directed block heatmap
 Force directed block degree rendering - just because I like the colours
Other Threads
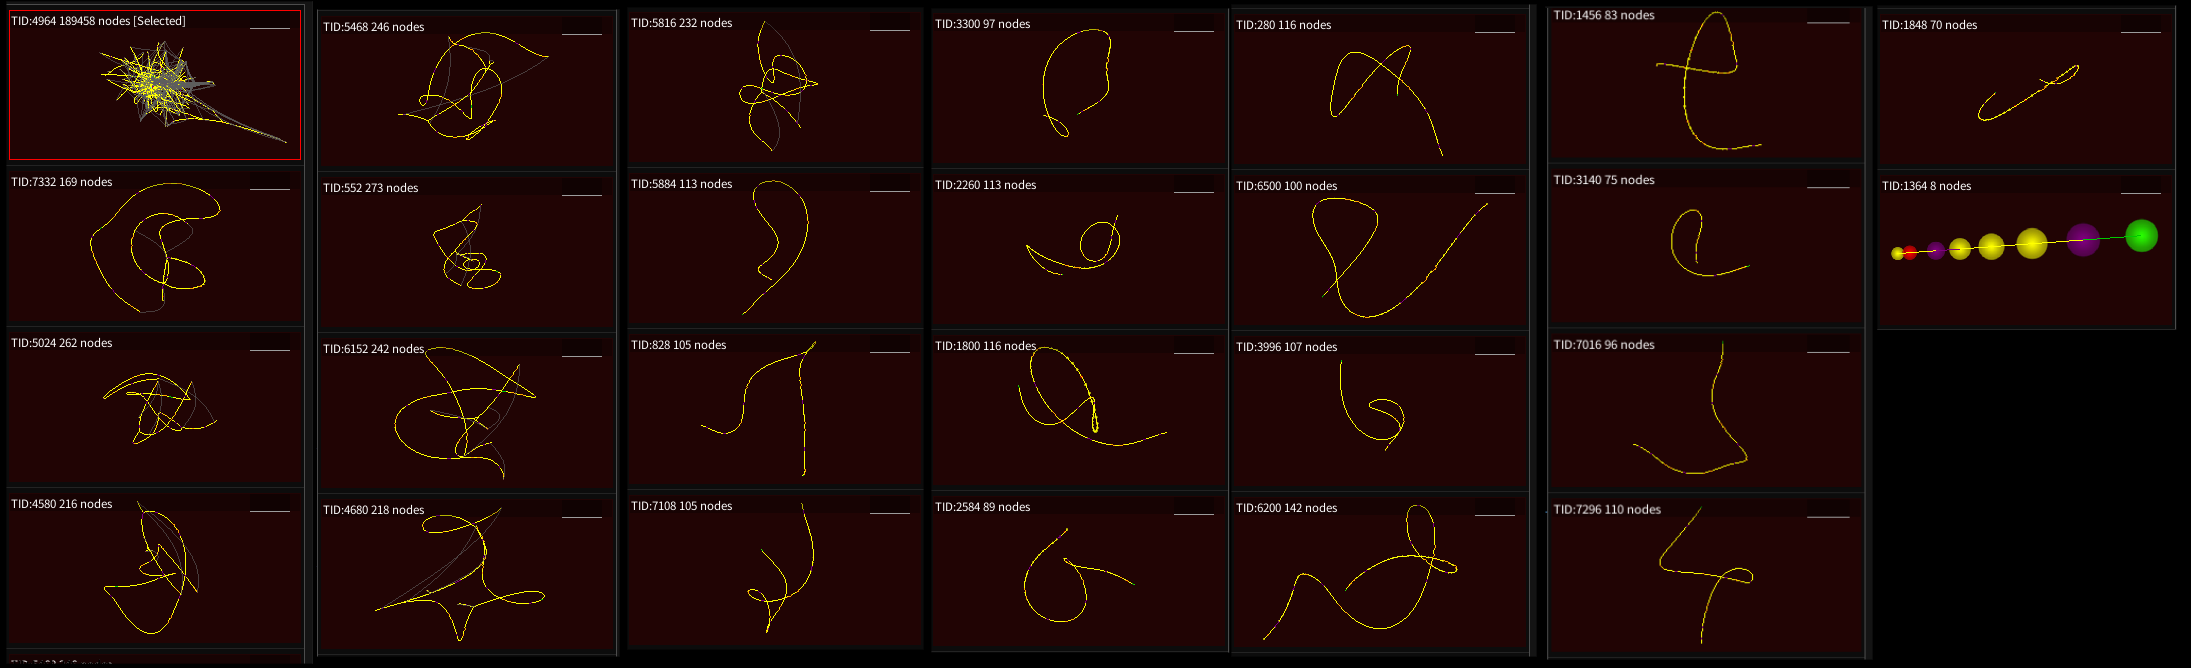
This spawns a lot of threads! Most of them are very simple - highlights here are debugger detection and multi-threaded unpacking
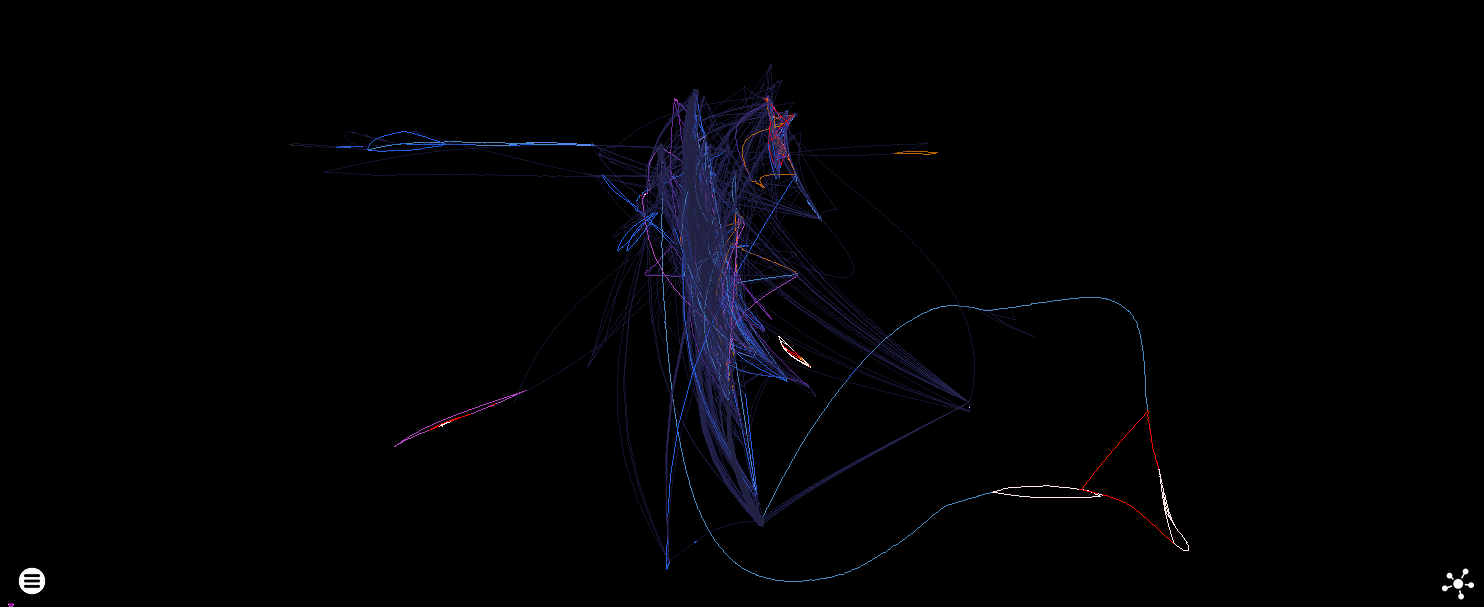
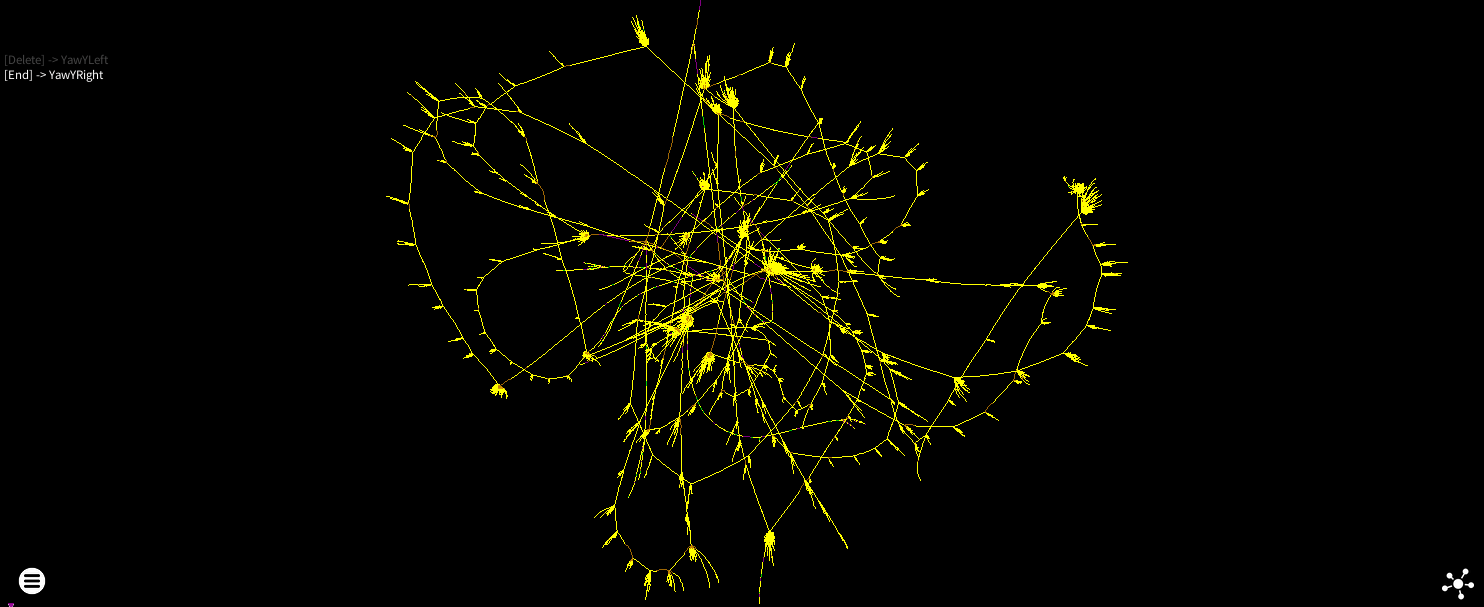
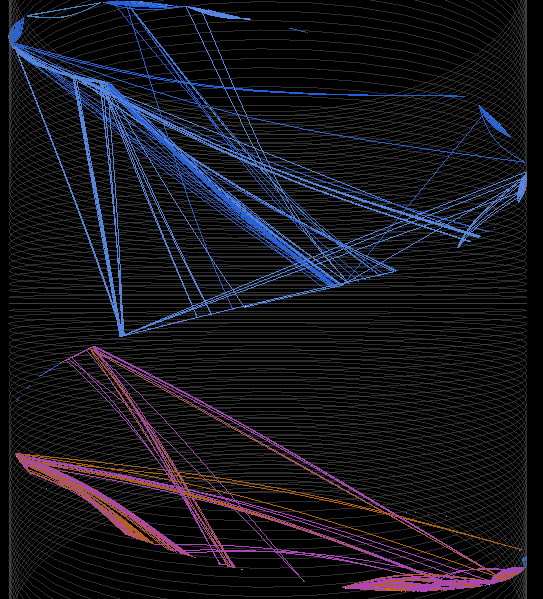
Themida 3
Themida 3 seems to have dispensed with the ‘kitchen sink of random obfuscation techniques’ protection and focused on a core of more reliable techniques. It detects Pin, so I had to disable debugger detection for this in lieu of an anti-anti-debugging sprint.
The main thread clocks in at just over 110K unique instructions - with 378M executed in total.
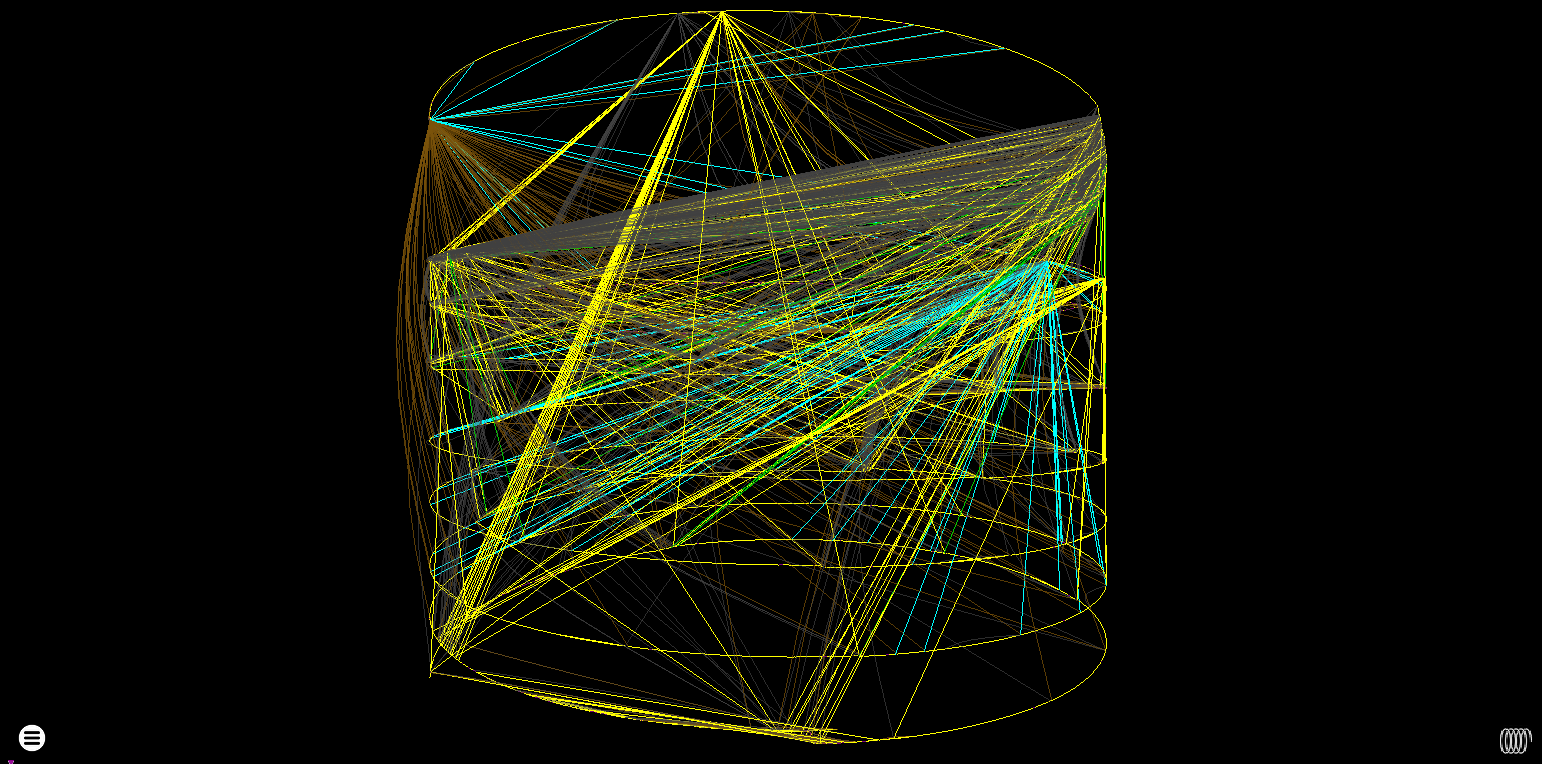
 The cylinder suffers from the control flow graph being highly interconnected
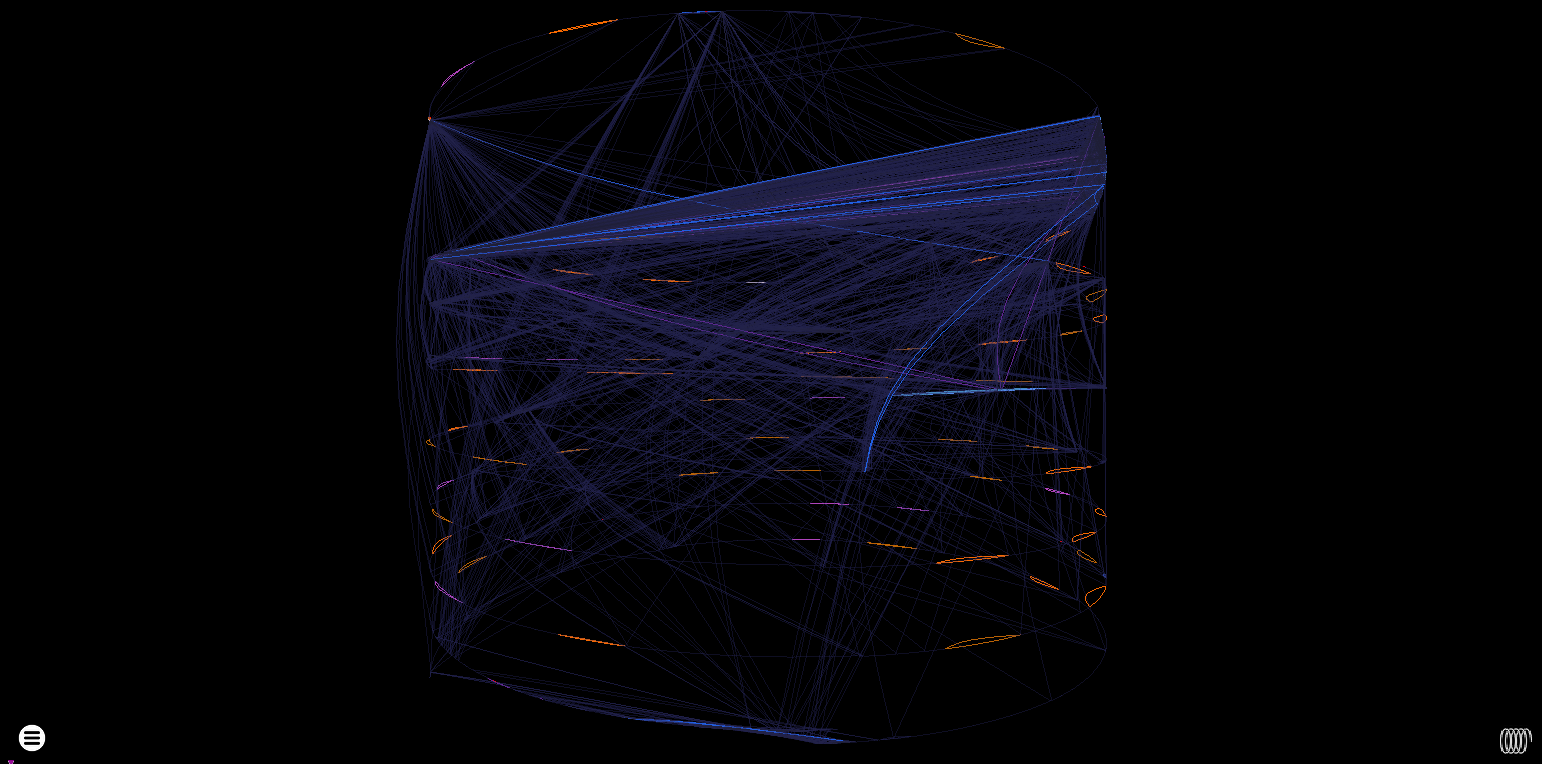
 Much Less useful heatmap
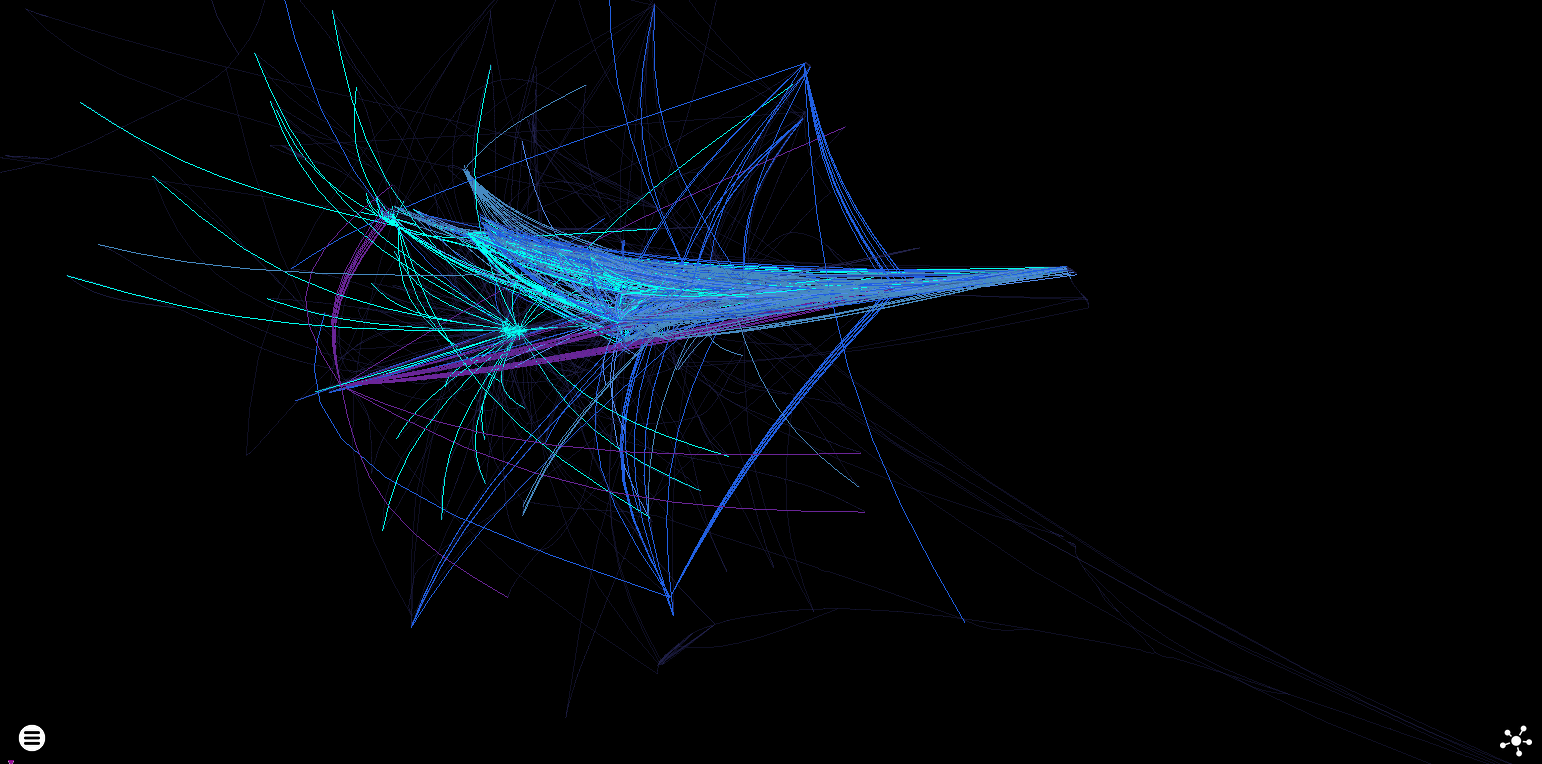
 The force directed layout redeems itself a little
 Loops!
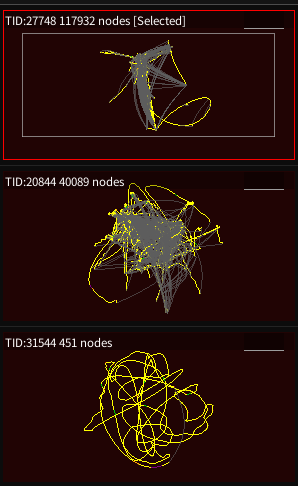 This has far fewer threads - one of these is for the Demo UI
UPX
Any discussion of packers is incomplete without UPX - our test program was expanded to a graph with a mere 208 nodes (with 58K instructions executed)
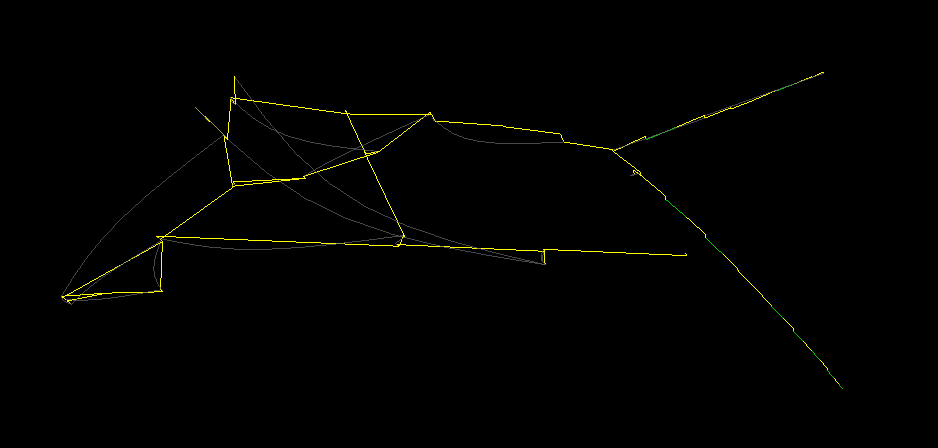 Force directed block control flow rendering
 Cylinder heatmap rendering
VMProtect
The VMP protected sample weighs in at over 2 billion instructions (110K~ unique) in its single thread, which makes it rather hefty. This is not a performance evaluation blog - but - if you are thinking of creating a fancy tech startup that revolves around shipping high-performance hello world binaries (with trade secrets in?) then you probably don’t want to use this.
 Force directed block control flow rendering
 Cylinder heatmap rendering
I also couldn’t gather this trace through remote tracing due (this bug) - it makes it to about 250M instructions before stopping - as well as the Pin named pipe bug, so that’s another thing on the list to fix.