Published: Nov 19, 2021 by Nia Catlin
Intro
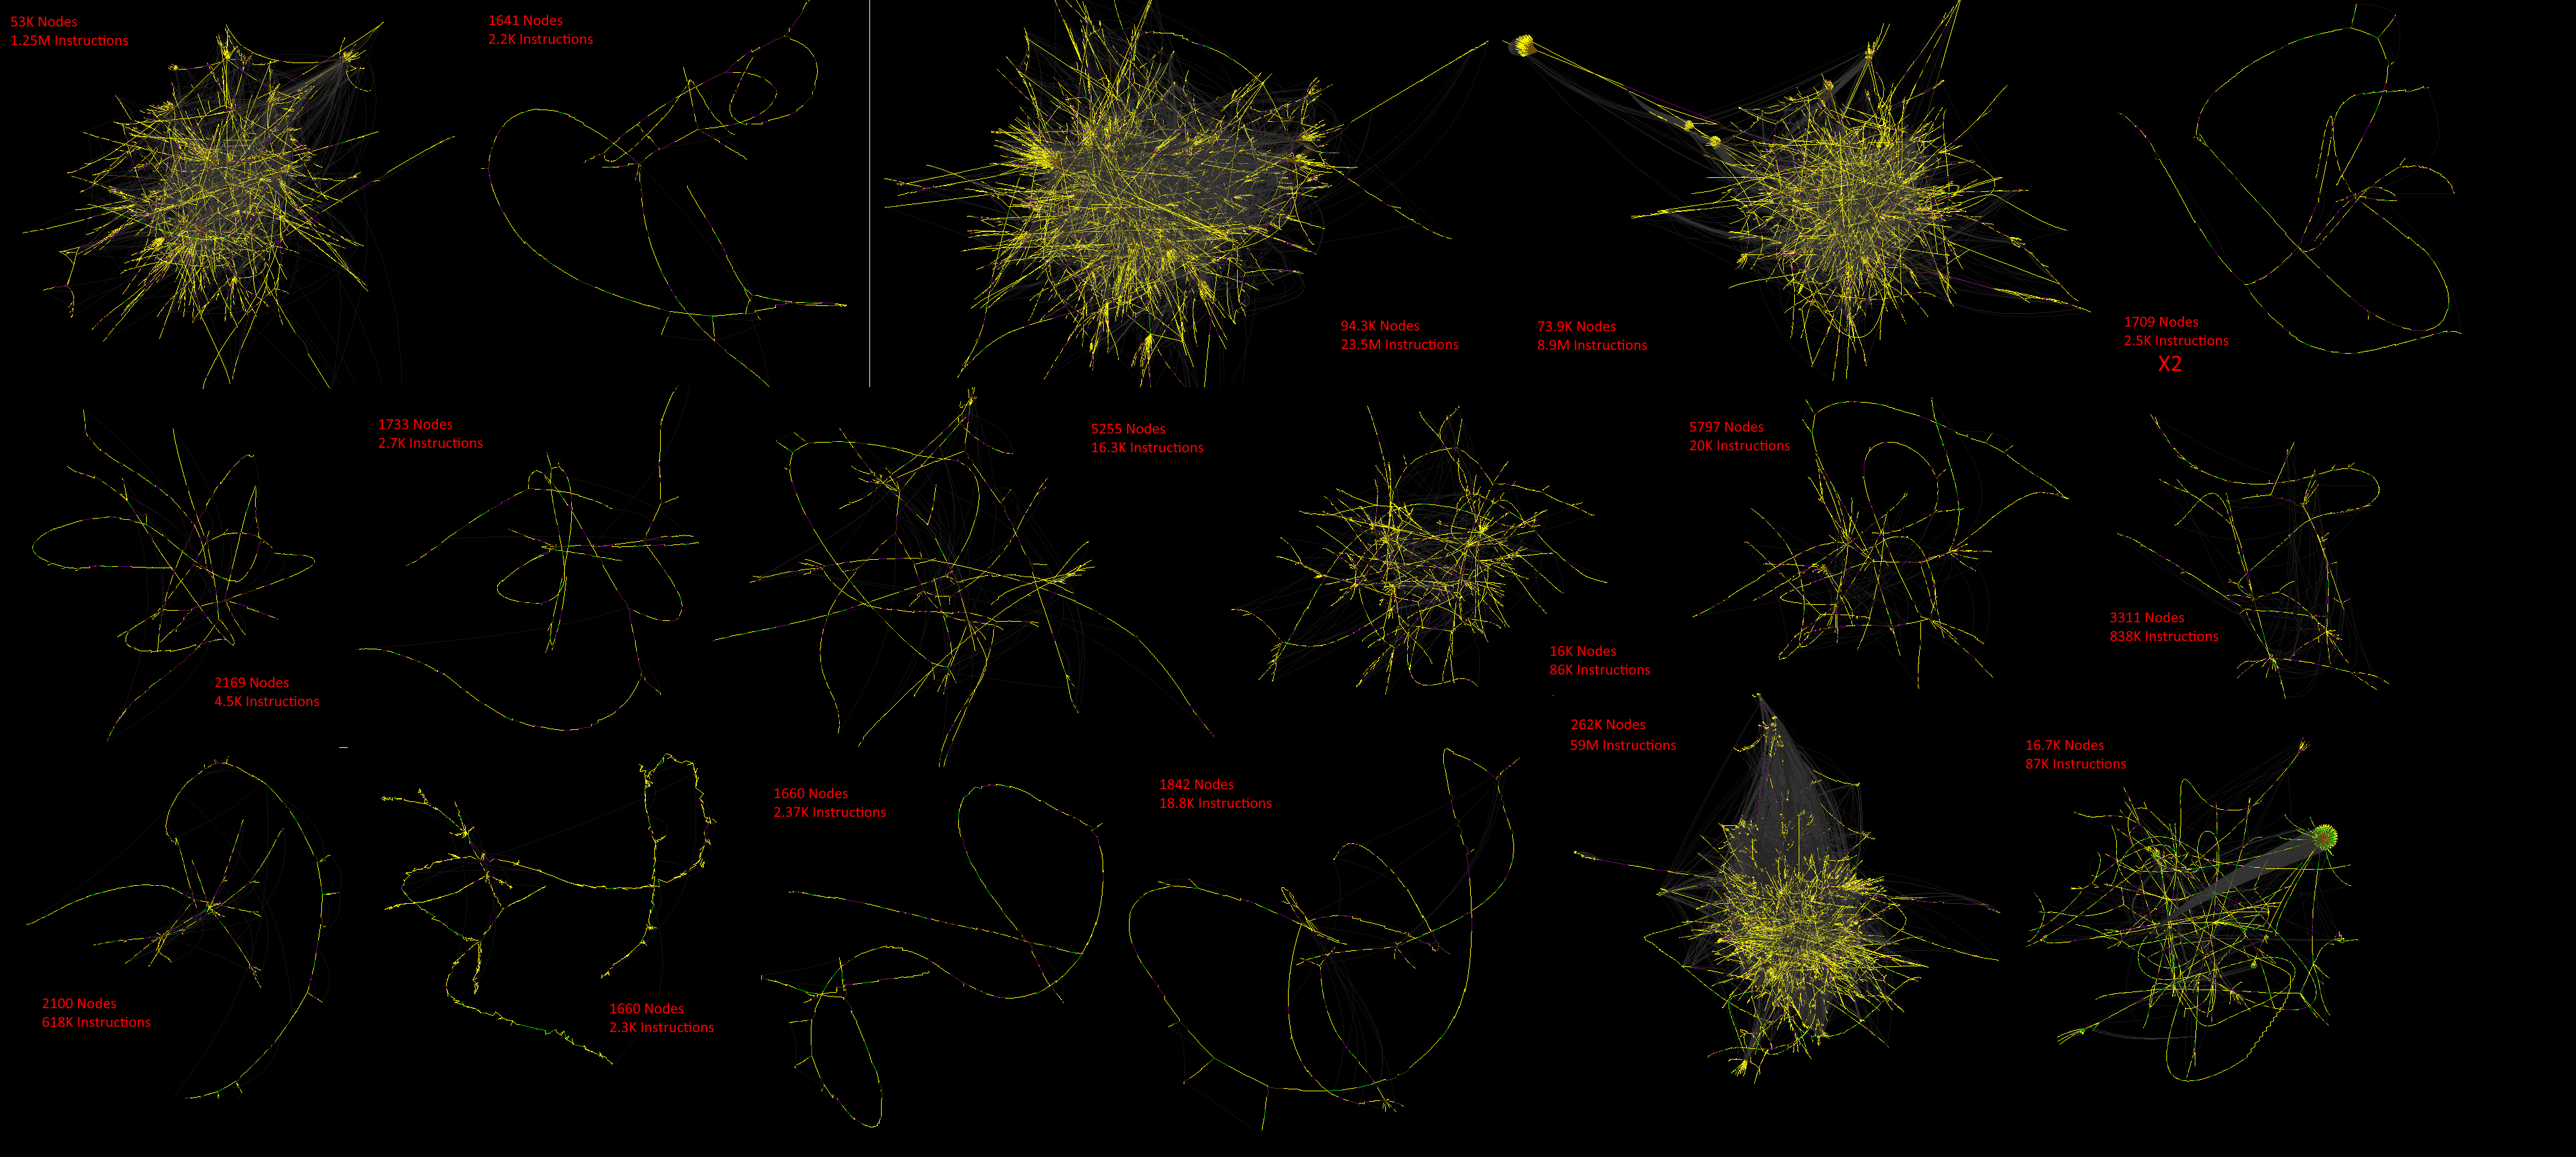
This post covers some testing of instruction trace gathering and visualisation capability on the hello binaries of 13 different languages. It’s mainly graphs and a bit of commentary - if you want technical details you may like the post about recording traces.
Disclaimer: The following graphs are visualisations of instruction traces generated from Windows compiled or interpreted programs written in each language. These were created to test rgat and are not intended to be used as a time/space critique of these languages. Don’t try to draw any useful conclusions from these graphs unless you are a purveyor of tiny, high-performance hello world programs.
Methodology: Programs were compiled from The Hello World Collection on Windows 10 using recent versions of the available x64 tooling. Release builds were generated where relevant.
Sources/Binaries can be found here
Plots are ordered by the total number of instructions executed as recorded by Pin. The raw instruction count is gathered with the sample Pintool provided with the Intel Pin kit - these counts include code in Windows libraries. Code in the Windows directory is not instrumented by the traces shown, so there will generally be far fewer instructions on the graph layouts. Any reference to ‘Nodes’ refers to instructions with a unique address, whereas ‘instructions executed’ refers to the total number of times all instructions were executed.
Chosen languages are a mix of the GitHub top languages, languages that are interesting from a malware perspective and any other language where I just wondered what the control flow graph would look like.
- Intro
- x64 Assembly (MASM)
- C (GCC 4.8.3)
- C++ (MSVC 14.29.30133, Visual Studio Community 2019)
- Ada (GNAT Studio Community 2021 [20210423])
- Rust (1.56.1)
- Delphi (Embarcadero Delphi 10.4 Community Edition)
- Golang (go1.17.3 windows/amd64) [Failed]
- AutoIt (v3, Bundled to an EXE with Aut2exe)
- Java (OpenJDK Runtime Environment (build 17.0.1+12-39), JRE executed directly)
- C# (.NET 5, Self-contained executable)
- Javascript (Node.js windows-x64-17.1.0 bundled with nexe)
- Python (CPython 3.10, PyInstaller Wrapped)
- Ruby (ruby 3.0.2p107, Interpreter executed directly)
- Conclusions
x64 Assembly (MASM)
Raw instruction count (including windows libraries)
Number of instructions: 220,029
Number of basic blocks: 49,627
This is our base for comparison.
 Nothing to get excited about here - 11 instructions and a couple of API calls.
C (GCC 4.8.3)
Raw instruction count (including windows libraries)
Number of instructions: 662,569
Number of basic blocks: 151,304
 The compiler pads the assembly out with initialisation of the stack cookie and the C runtime library. 536 Nodes, 1.1k instructions executed
C++ (MSVC 14.29.30133, Visual Studio Community 2019)
Raw instruction count (including windows libraries)
Number of instructions: 2,413,122
Number of basic blocks: 568,565
 520 nodes, 511 instructions executed.
The VC++ output has a higher number of instructions executed because of the increased API usage - the actual setup code that executes is lighter than GCCs C output.
Ada (GNAT Studio Community 2021 [20210423])
Raw instruction count (including windows libraries)
Number of instructions: 2,034,262
Number of basic blocks: 465,783
Not a particularly fashionable language generally or among malware authors - I was just curious how everyone’s favorite designed-by-huge-committee language looked under the hood.
 3700 Nodes, 55.24K instructions executed
 Nestled under the standard looking setup stub is this long chain of little loops
Rust (1.56.1)
Raw instruction count (including windows libraries)
Number of instructions: 4,326,506
Number of basic blocks: 984,090
The vast majority of the above instructions are in Windows library calls - the Rust output was really surprisingly simple
 1946 Nodes, 2.37K instructions
Delphi (Embarcadero Delphi 10.4 Community Edition)
Raw instruction count (including windows libraries)
Number of instructions: 5,293,646
Number of basic blocks: 1,191,836
 Delphi’s setup stub does some actual work. 2013 nodes, 56.5K instructions executed
Golang (go1.17.3 windows/amd64) [Failed]
Raw instruction count (including windows libraries)
Number of instructions: ? (> 5,956,506)
Number of basic blocks: ? (> 1,308,592)
Go binaries have (probably slightly undeserved) reputation for being unpleasant to reverse engineer, and this one didn’t disappoint- killing Pin before finishing its setup.
Trying to perform the initial instruction counting resulted in:
Exception 0xc0000005 0x0 0xc000053d00 0xc000053d00
PC=0xc000053d00

runtime: unknown pc 0xc000053d00
stack: frame={sp:0xc000053bd0, fp:0x0} stack=[0xc000052000,0xc000054000)
0x000000c000053ad0:  0x0000000000000000  0x0000000000000000
0x000000c000053ae0:  0x0000000000000000  0x0000000000000000
0x000000c000053af0:  0x0000000000000000  0x0000000000000000
0x000000c000053b00:  0x0000000000000000  0x0000000000000000
0x000000c000053b10:  0x0000000000000000  0x0000000000000000
0x000000c000053b20:  0x0000000000000000  0x0000000000000000
--snip--
rgat’s pintool met a similar fate, so the following are just partial graphs
 The main thread, before crashing. 25K nodes, 1.77M instructions

AutoIt (v3, Bundled to an EXE with Aut2exe)
Raw instruction count (including windows libraries)
Number of instructions: 23,807,052
Number of basic blocks: 5,376,610
Mainly of interest from a malware perspective, I expected problems on seeing this 23M instruction count but AutoIt actually produces really quite compact graphs. It must call some very heavy Windows APIs.
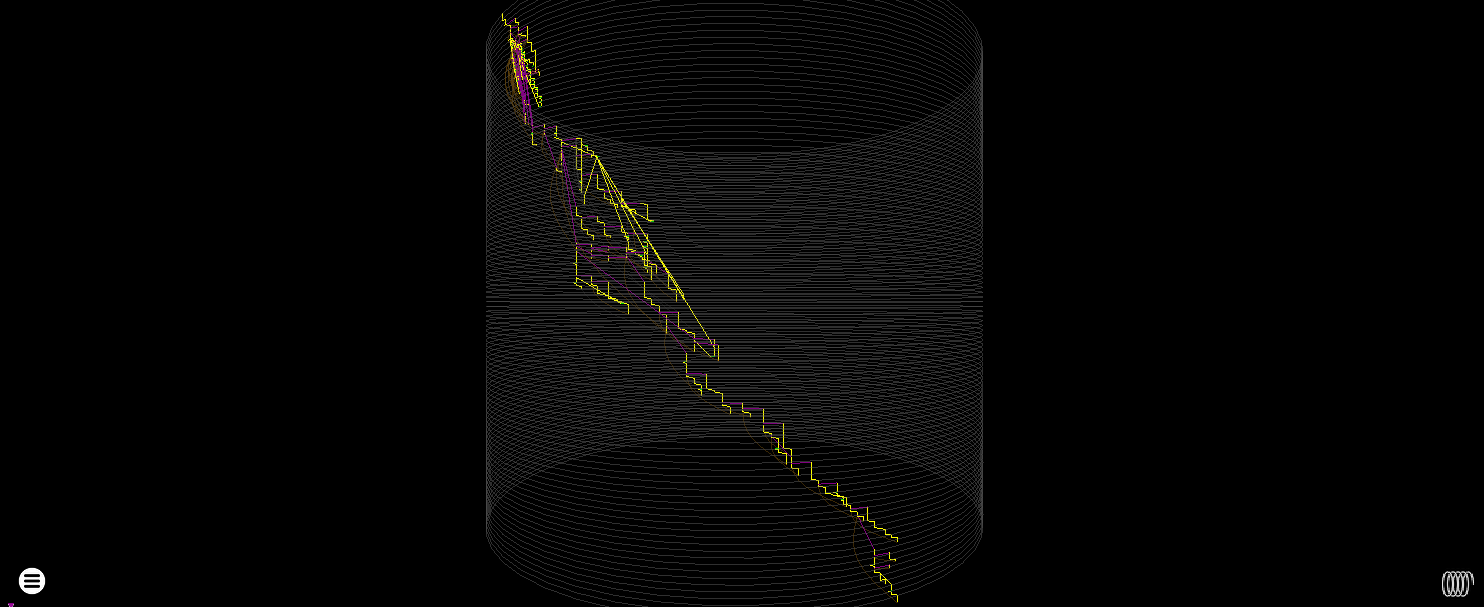
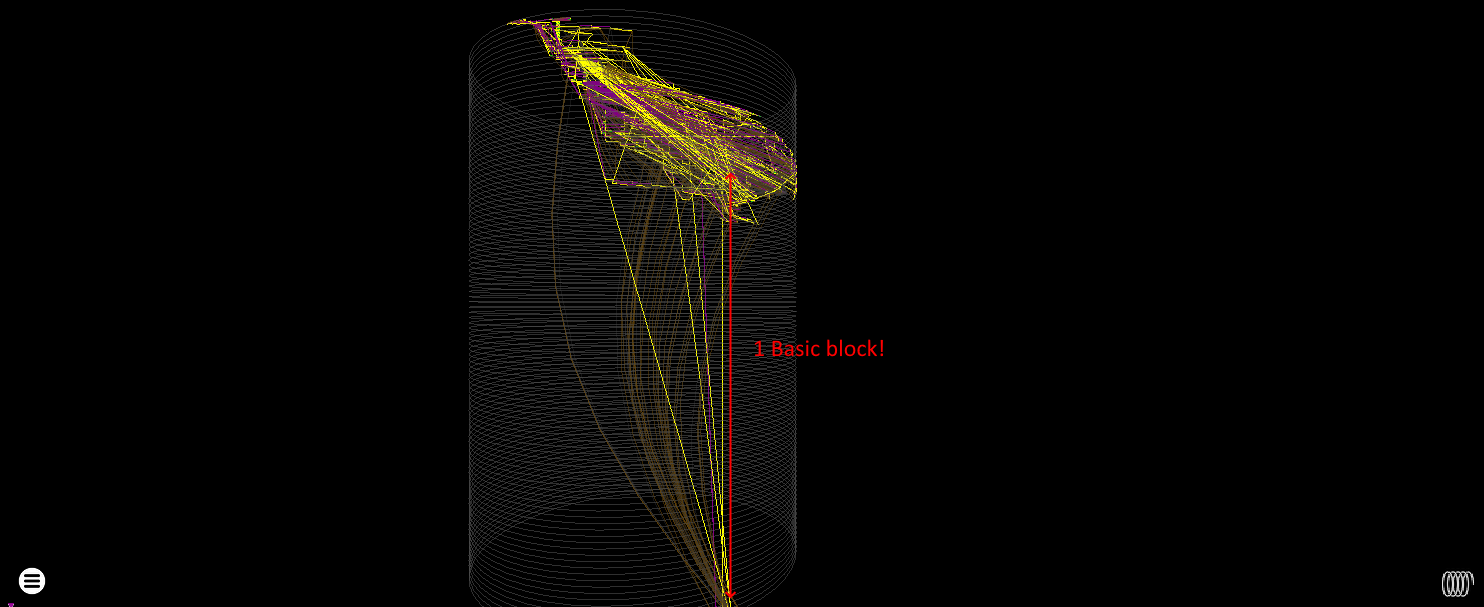 14890 Nodes, 251K instrumented instructions. The cylinder plot is deformed by a monster of a basic block
Java (OpenJDK Runtime Environment (build 17.0.1+12-39), JRE executed directly)
Raw instruction count (including windows libraries)
Number of instructions: 101,474,902
Number of basic blocks: 20,404,201
Java was the only trace where many complex threads were generated, so have a wall of graphs:
C# (.NET 5, Self-contained executable)
Raw instruction count (including windows libraries)
Number of instructions: 115,535,357
Number of basic blocks: 25,272,210
Considering the relatively small number of instructions this executes compared to Ruby/Python) I was hoping this would be a relatively simple trace to deal with, but with over 50 threads and a main graph over 280,000 nodes - it was not.
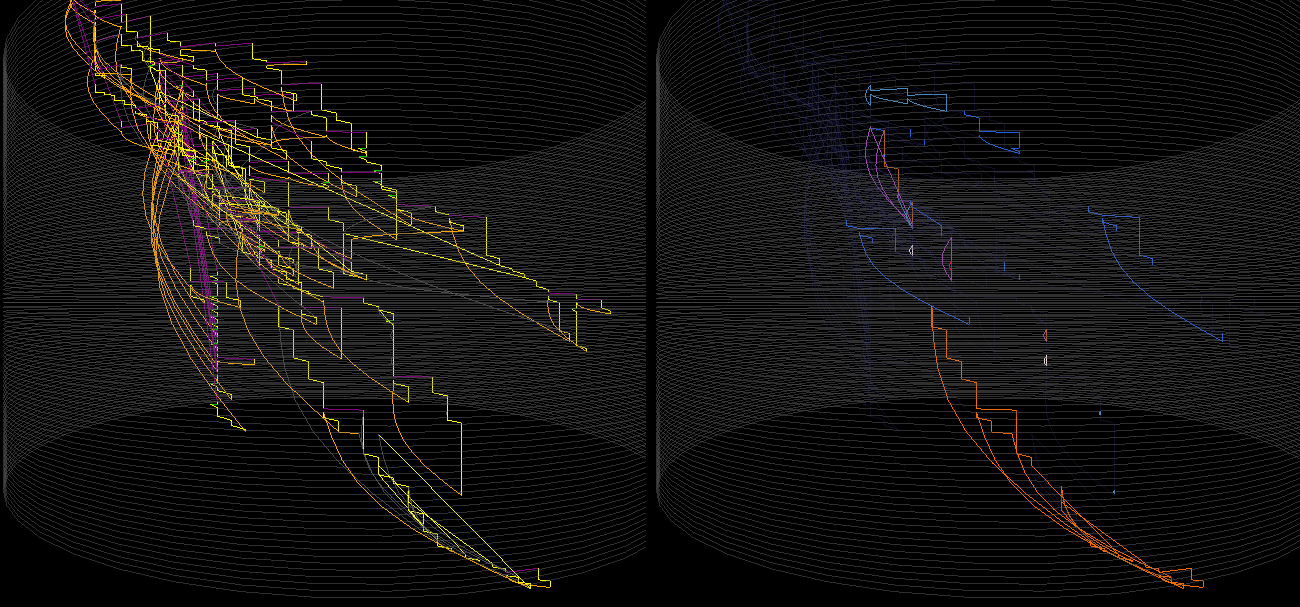
Cylinder plot. From left to right: Control flow graph, heatmap and node degree rendering
The main complication is all the threads - Pin doesn’t currently provide a safe way of accessing Windows named pipes - which is how rgat communicates, spawning a pipe for every thread - so each thread is rolling a dice on deadlocking. The instruction counter pintool sees only 12 threads, so it probably just spawns threads regularly.
The node count is also beyond anything we can create a useful force-directed layout with using Fruchterman-Reingold
Javascript (Node.js windows-x64-17.1.0 bundled with nexe)
Raw instruction count (including windows libraries)
Number of instructions: 234,399,444
Number of basic blocks: 41,162,137
The force-directed layout of the main thread looks pretty much exactly how you would expect a 205 million instruction trace to look when you throw some forces at it and hope it turns into a nice layout. The graph has 360K nodes.
 The heatmap render at least can still come in useful
Not pictured are a few smaller (but much simpler) threads that would bring the instruction count up by another few million.
Python (CPython 3.10, PyInstaller Wrapped)
Raw instruction count (including windows libraries)
Number of instructions: 268,1086,59
Number of basic blocks: 39,159,539
Python was the easiest trace of a big interpreter - as everything happens in a single thread and there is no JIT code to make life difficult and a paltry 13,483 nodes to layout on the resulting graph.
 Force directed plot of Hello World in Python 3 - 264.13 million instructions (13,483 unique).
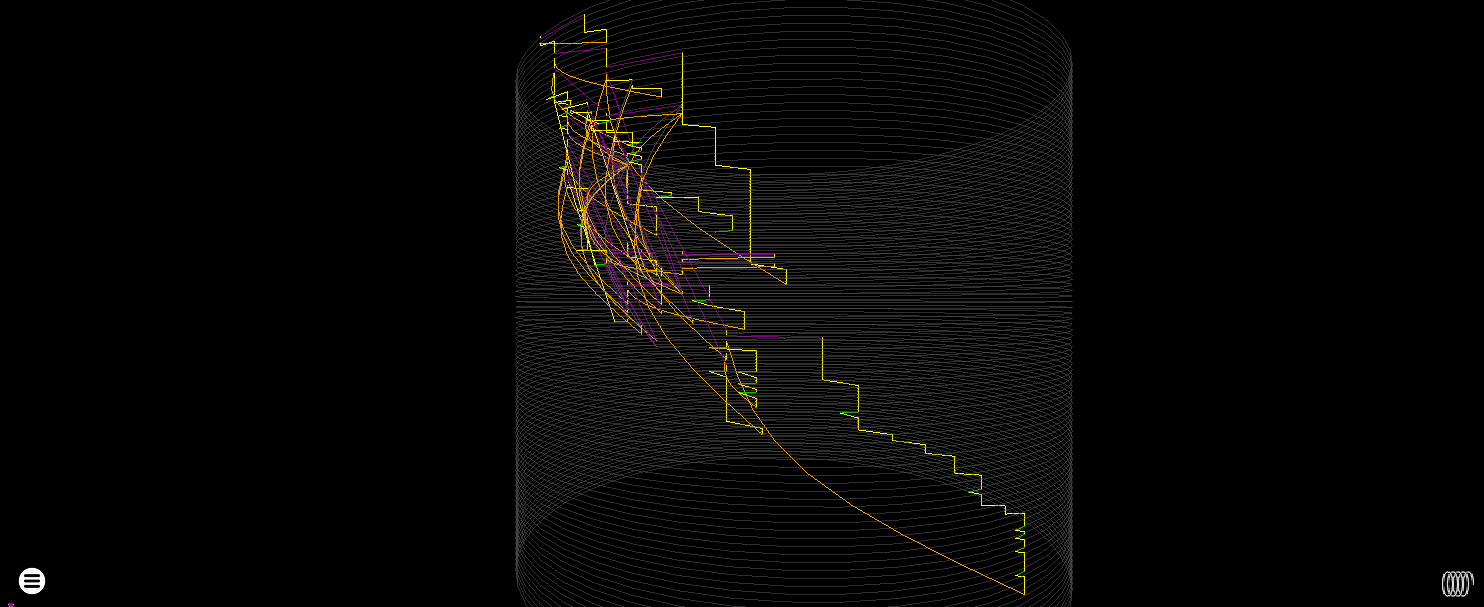
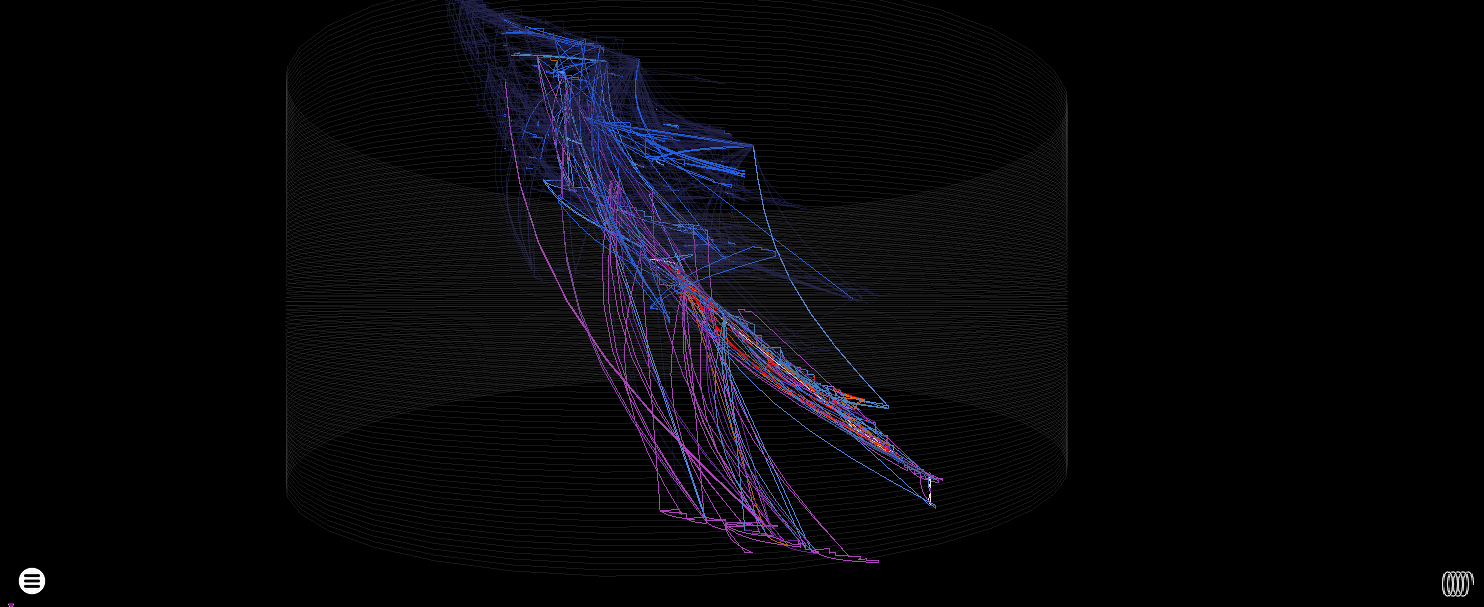 Cylinder heatmap render - the WriteFile to the console happens at the very bottom
Ruby (ruby 3.0.2p107, Interpreter executed directly)
Raw instruction count (including windows libraries)
Number of instructions: 314,162,380
Number of basic blocks: 63,395,930
314M instructions happens in the blink of an eye on modern processors, but trying to record and plot instruction traces of this is quite challenging.
Ruby was the easiest JIT’ted language to work with - the vast majority of its instructions happen in a single thread and nothing broke tracing too hard.
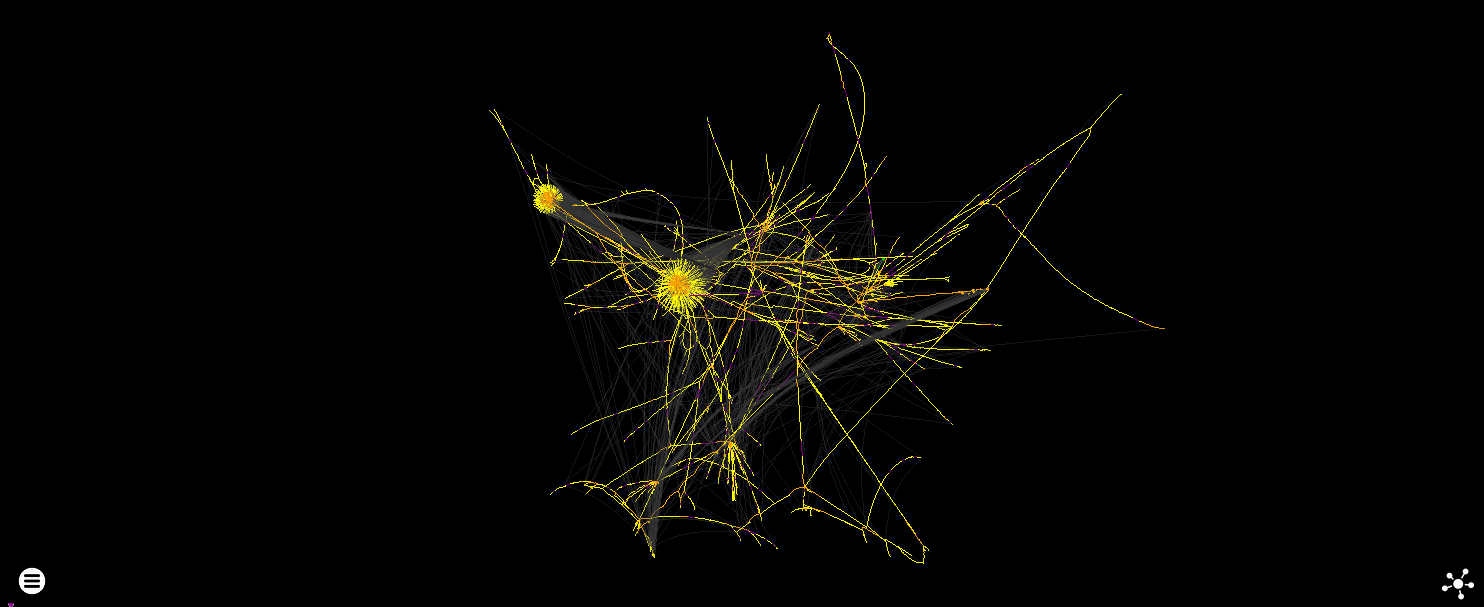
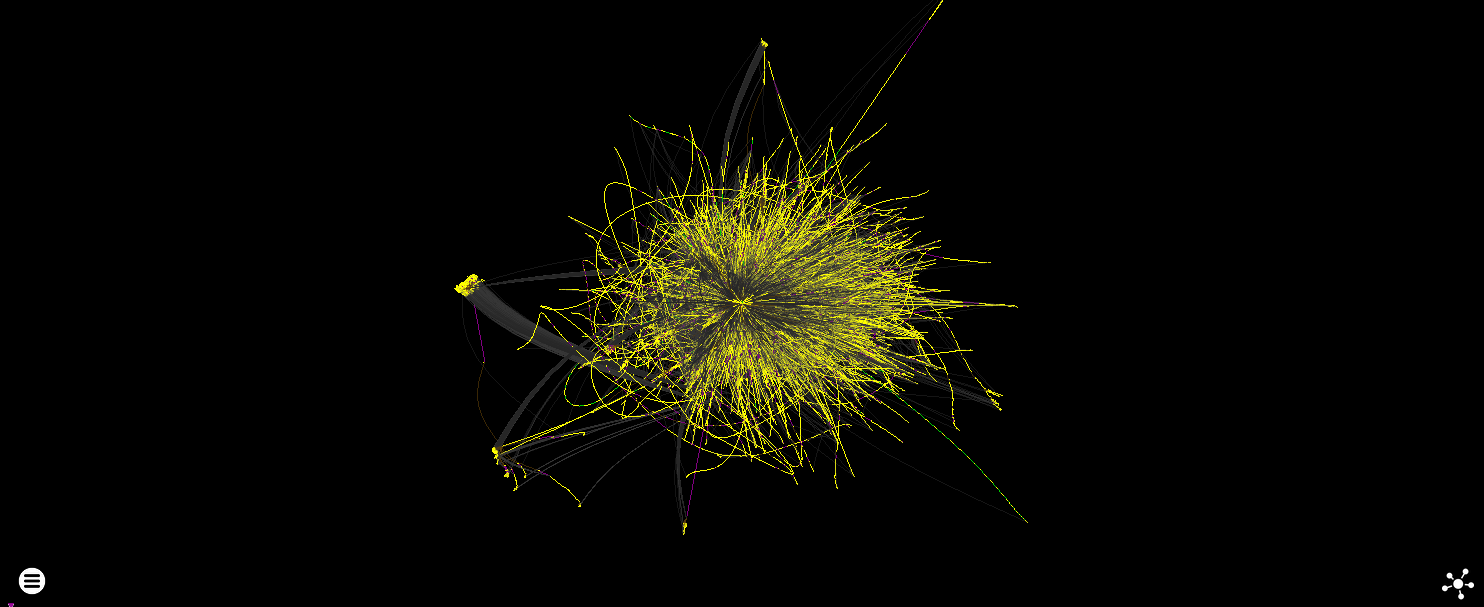
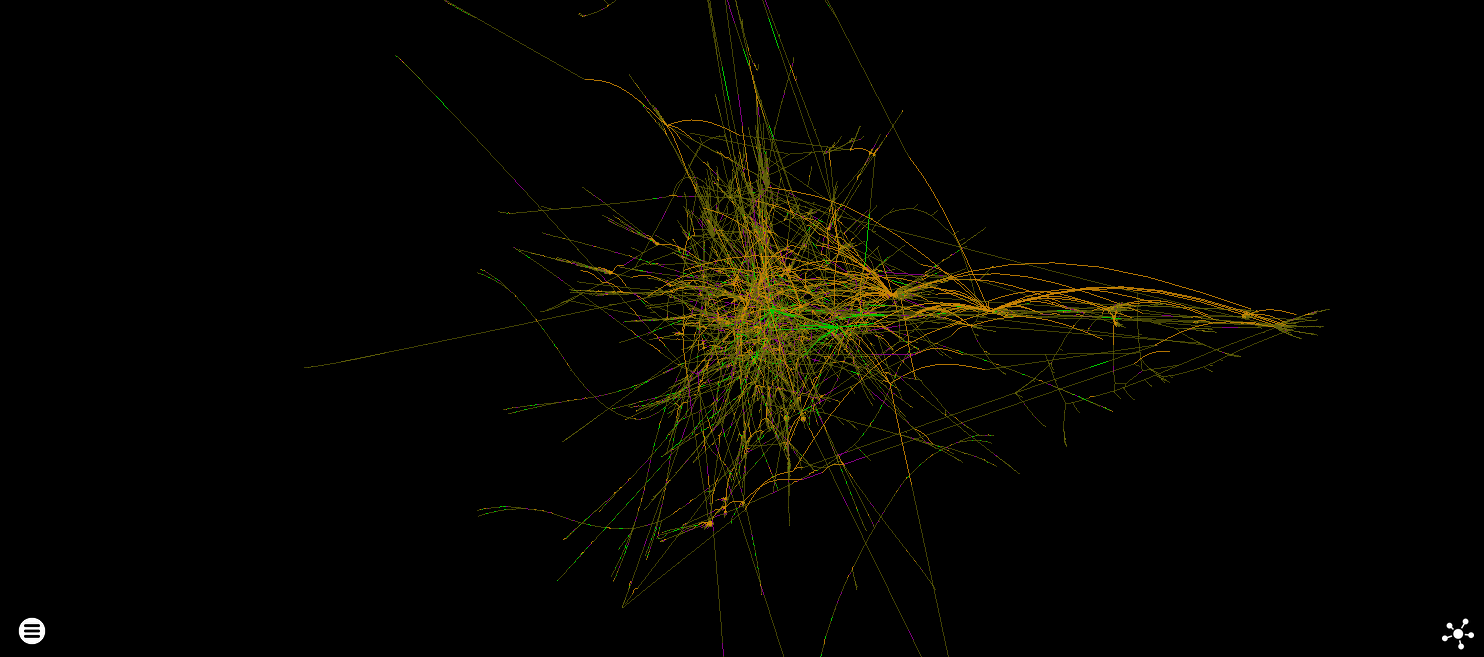 The standard experience of applying force directed layout to 150K highly-connected nodes. These instructions were executed a total of over 235 million times. Return edges and edges to previously seen instructions are faded for clarity.
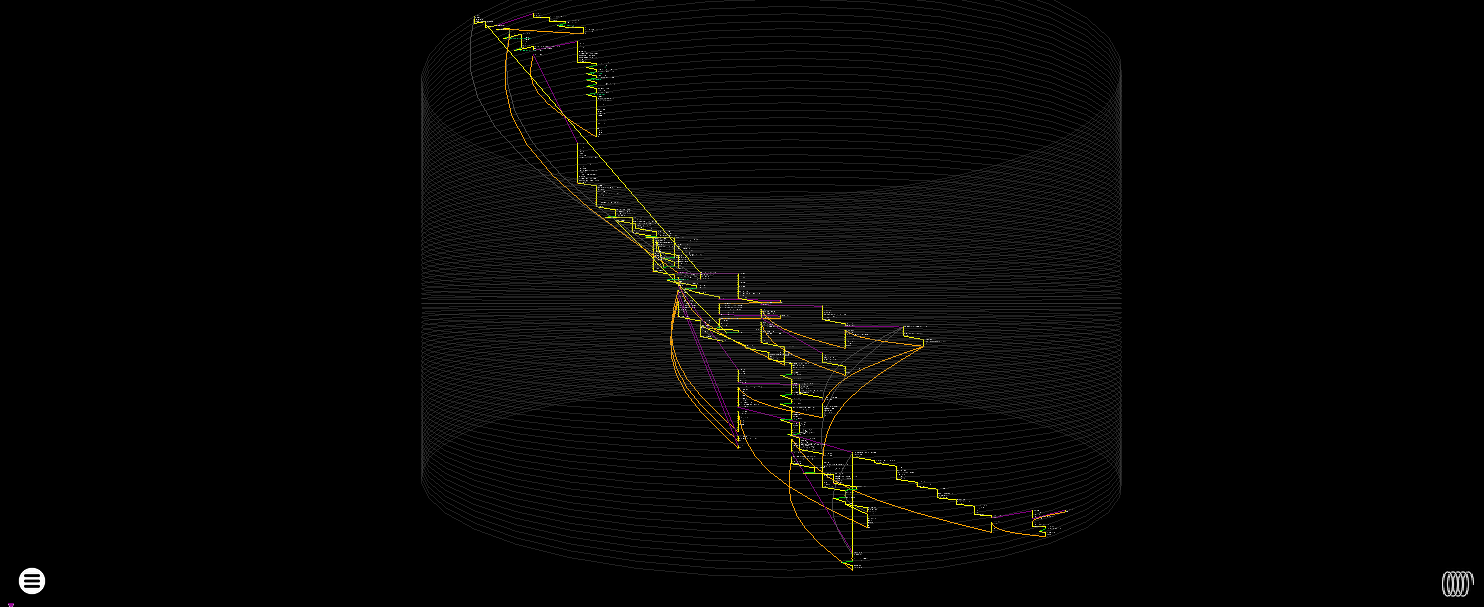
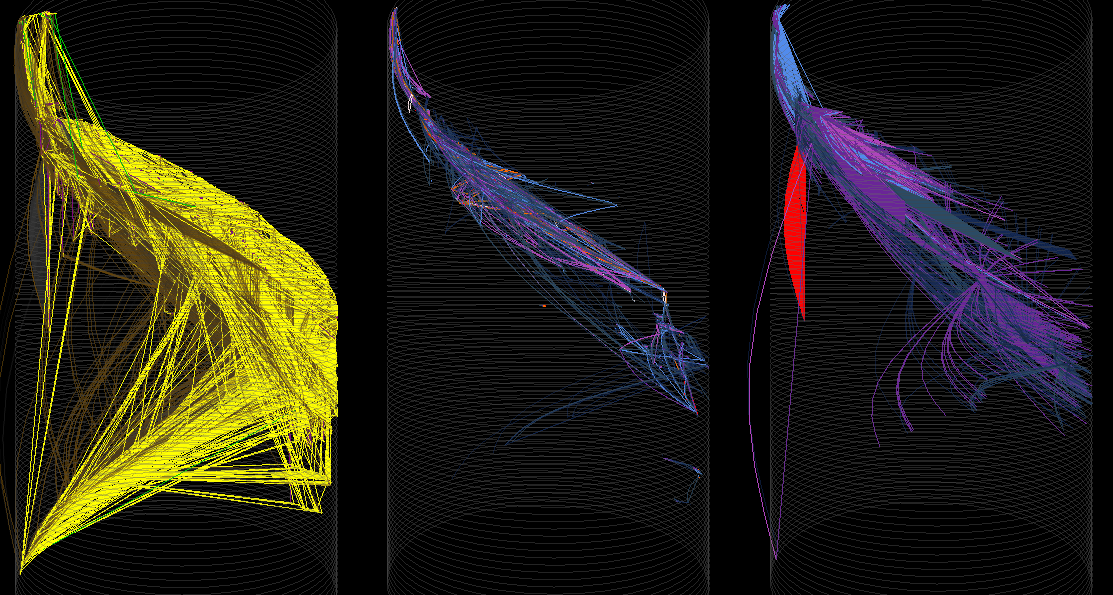
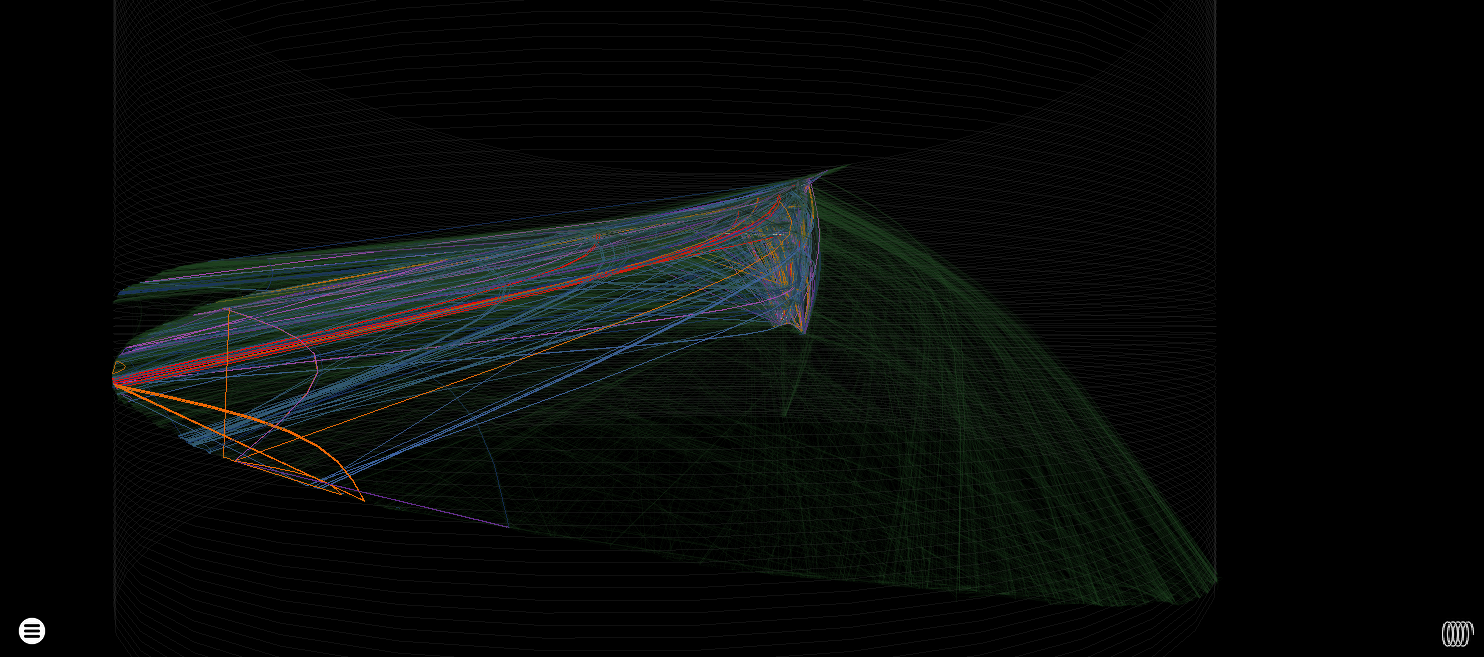 Cylinder heatmap render showing single execution (mostly JIT) code in green following the more looping control flow involved in starting the interpreter (all the other colours)
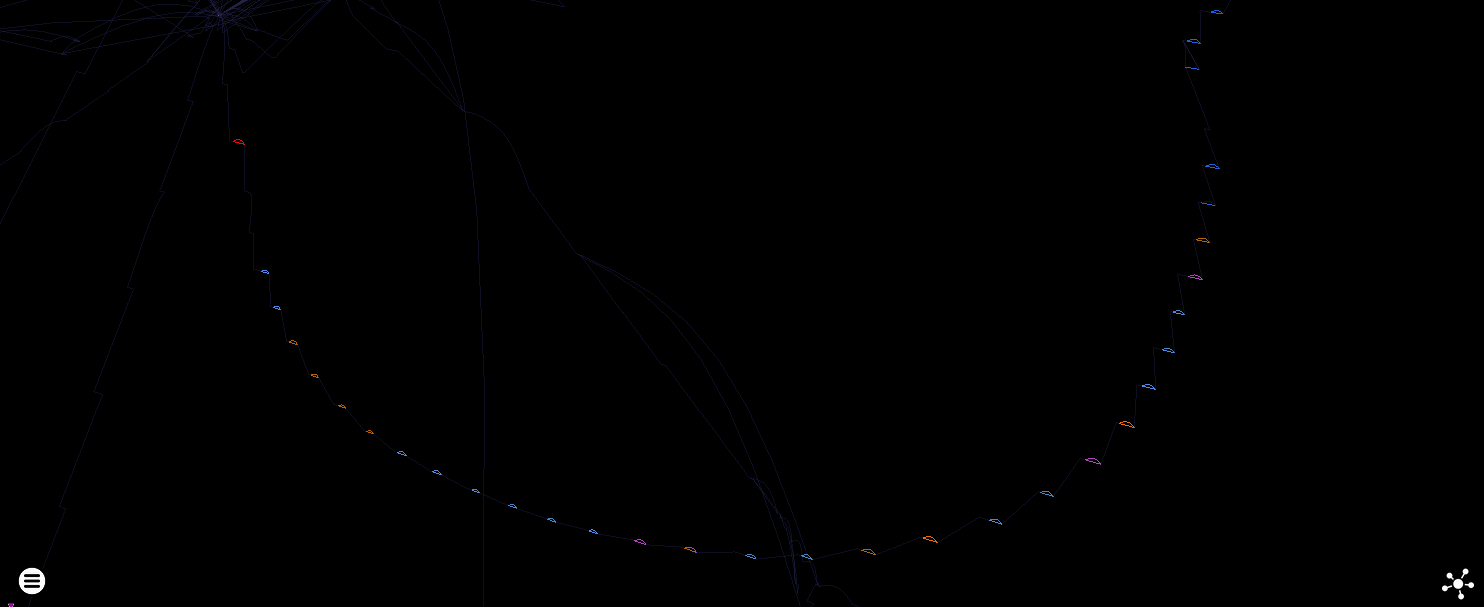
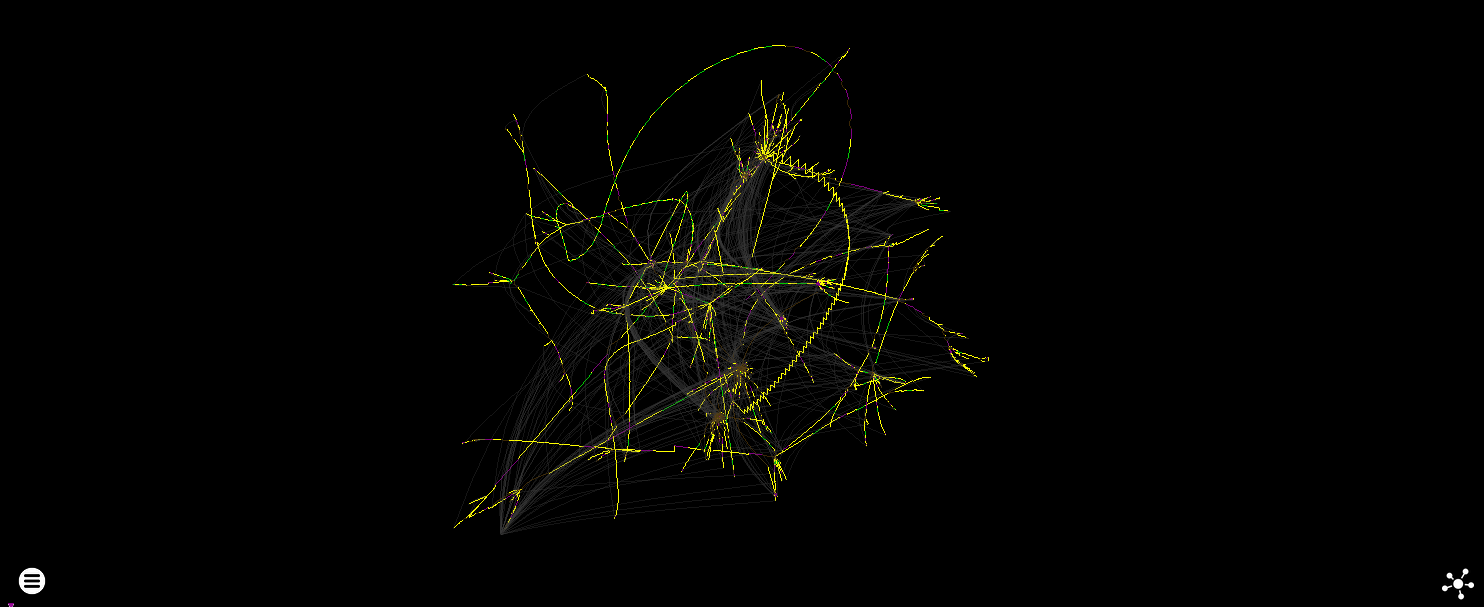
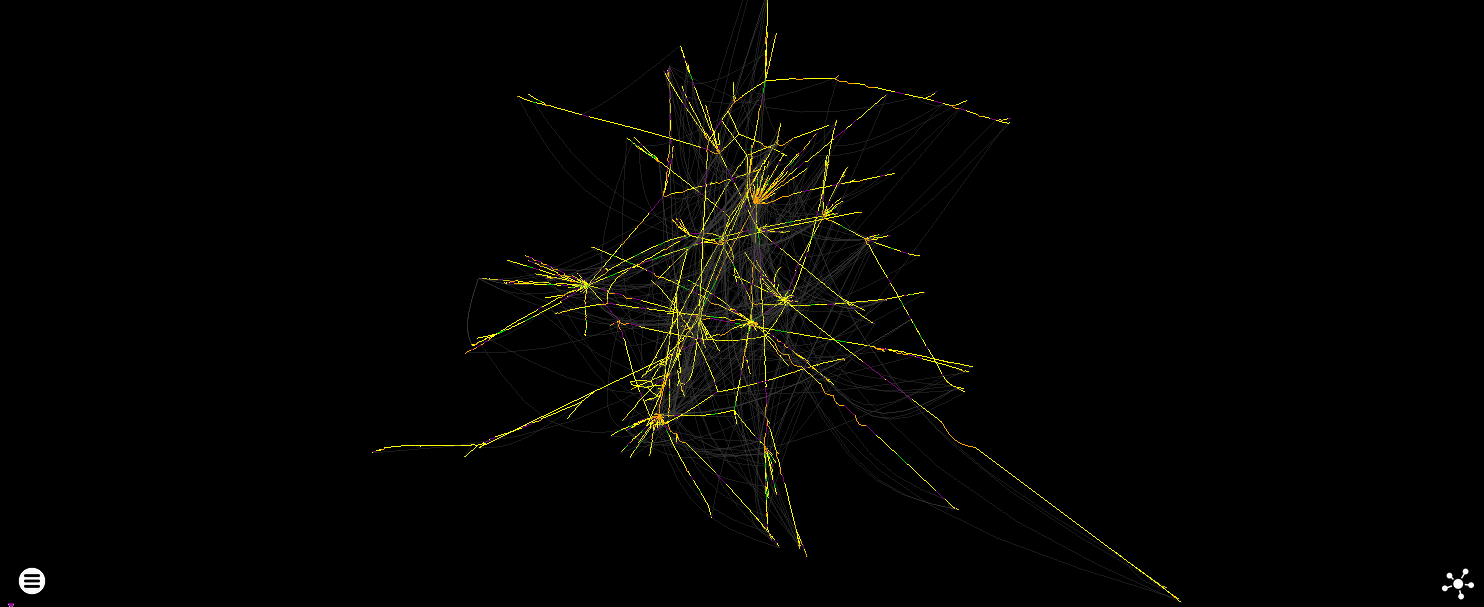
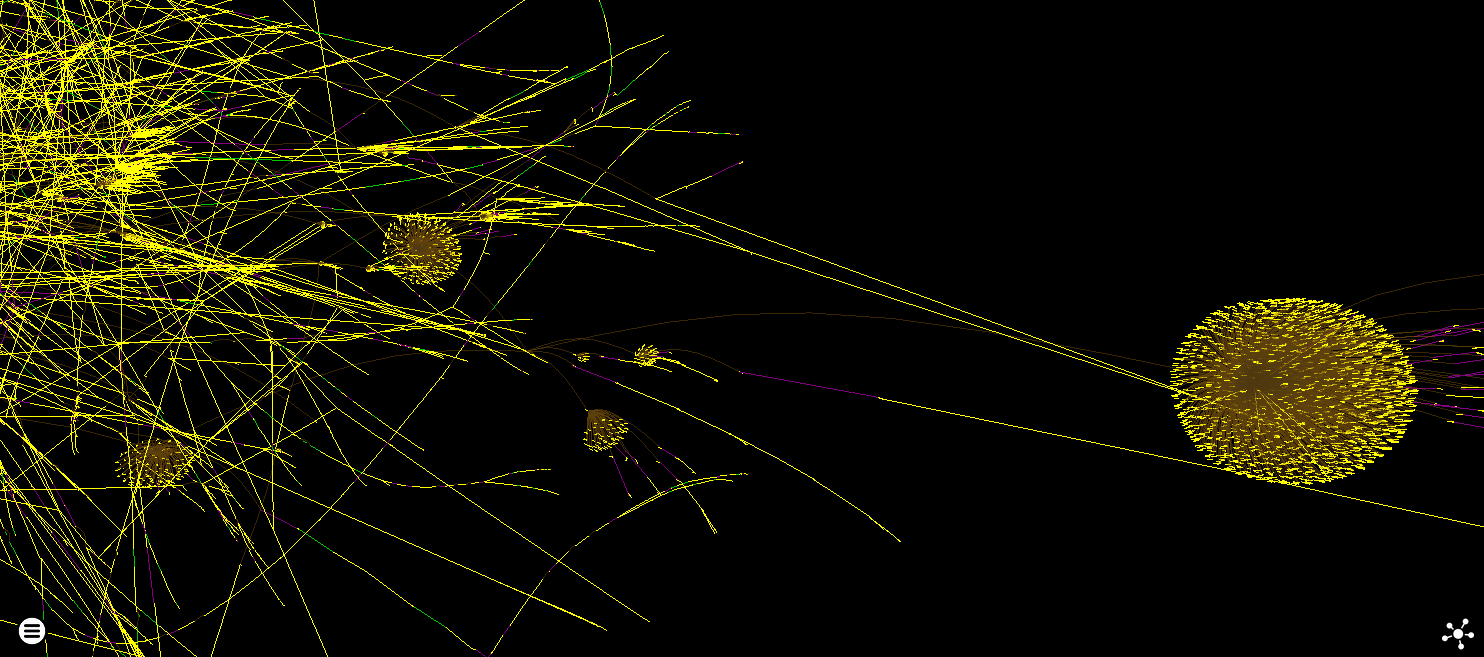 JIT code also tends to have a lot of these pom-pom structures in force directed layouts where lots of tiny code fragments are called by a central dispatcher (the internal orange edges are returns) - which you will also see with certain types of control flow obfuscation like flattening.
Conclusions
This was neat, a few bugs got fixed in the process. The interpreter graphs are a bit ridiculous but malware reverse engineers are unlikely to want to trace their native code. Upcoming on version 0.7’s roadmap is to augment the module ignore list with a memory region ignore list so uninteresting code like this just doesn’t get plotted.
See also: Similar post about Packers/Protectors