Graph Manipulation
Navigation
All graphs are rendered in a 3D space and can be rotated and moved.
Modifiers
Many keybinds can be used with keyboard modifiers to change their magnitude
| Modifiers | Multiplier | Note |
|---|---|---|
| None | No Multiplier | Small movements |
| Shift | Small Multiplier | Moderate movements |
| Ctrl | Large Multiplier | Huge movements |
| Shift + Ctrl | Proportional Multiplier | Larger or smaller than ctrl, depending on the current value. Useful for excessive plot sizes. |
The following useful default keybinds are configurable
Yaw
| Action | Keybind | Mouse |
|---|---|---|
| Yaw + | End | Alt+ Drag Left |
| Yaw - | Delete | Alt+ Drag Right |
Pitch
| Action | Keybind | Mouse |
|---|---|---|
| Pitch Forward | Page Up | Alt+ Drag Up |
| Pitch Back | Page Down | Alt+ Drag Down |
Roll
| Action | Keybind | Mouse |
|---|---|---|
| Roll Clockwise | Home | |
| Roll AntiClockwise | Insert |
Movement
Standard WASD and keyboard arrows can be used for moving on the X and Y axis, but mouse dragging is usually more comfortable. You can also drag the sliders in the control pane or double click them to set specific values.
Auto Centering
| Action | Keybind |
|---|---|
| Center View | Q |
| Keep View Centered | Shift-Q |
Static Layouts
Static layouts place instruction nodes according to rules, so they run very quickly and result in predictable plots with minimal configuration needed.
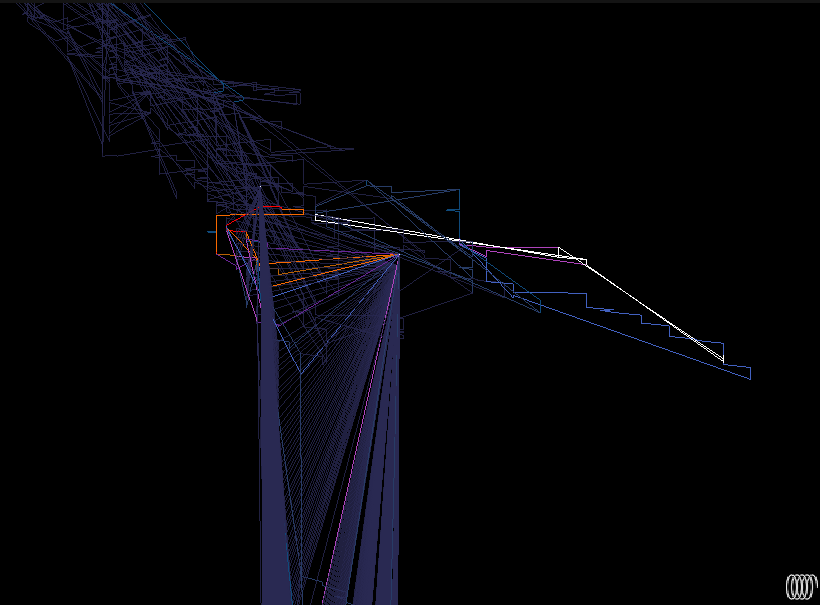
The Cylinder respects call/return relationships so it gives a traditional control flow graph layout
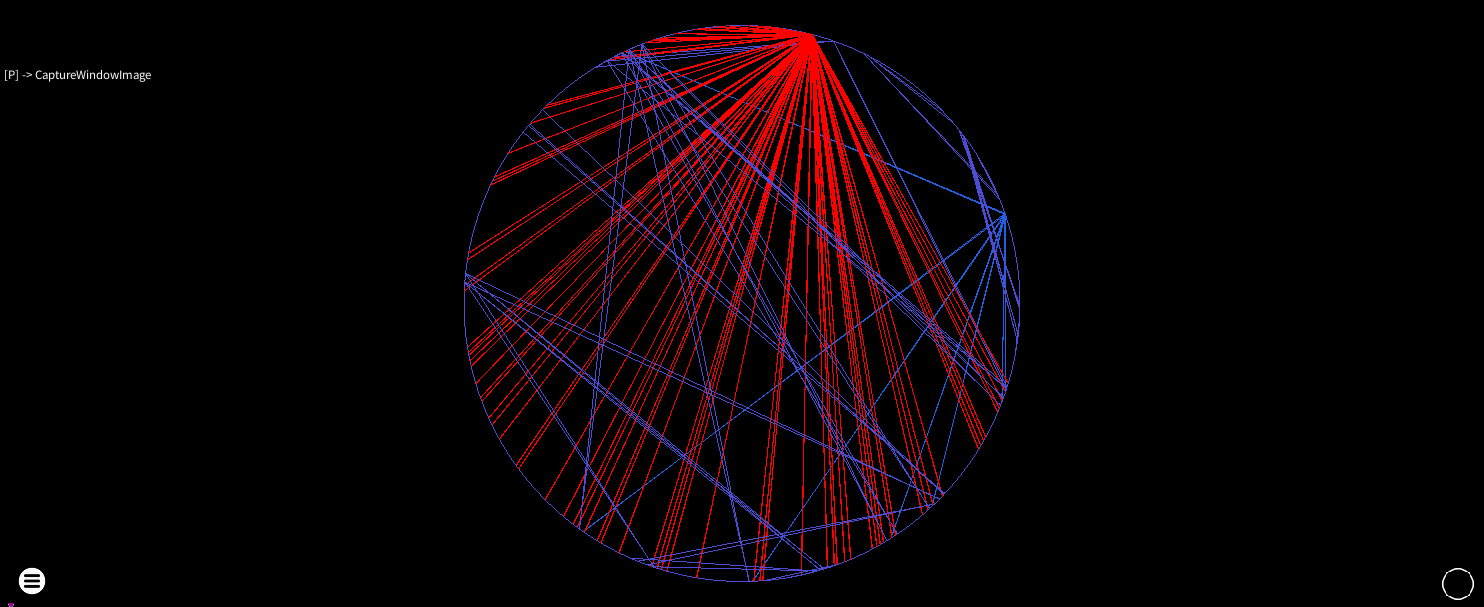
The circle layout may also be a useful way to find out where the most connected instructions are
Force Directed Layouts
The force-directed layouts offered by rgat in 0.6.0 are a basic Fruchterman-Reingold algorithm that repels each node away from each other and then attracts connected nodes towards each other.
The force applied is controlled by a temperature, which falls over time. After a number of steps (depending on the settings you apply) the nodes fall into an equilibrium which may or may not give you some insight into the structure of the program.
The two layouts offered are:
- Force-directed nodes: Each node is laid out independently
- Force-directed blocks: As above, but nodes are grouped together as basic blocks.
The blocks algorithm is significantly less taxing on the GPU and will probably give a more useful result. Depending on your GPU, the nodes algorithm may be able to handle a few hundred thousand unique instructions on a graph - at which point other layouts should be used.
It’s important to limit the amount of instrumented code to make this practical - though at the moment rgat can only do this at a module-level granularity.
Using the Quick Menu may be essential to getting a useful layout depending on the structure of the target you are working with.
Adjust node repulsion to control the size of the layout
High temperatures and speed limits can make graph layout fast, but nodes will shake violently when they approach equilibrium
Experiment with different replotting methods
Feature Colouration
| Action | Keybind |
|---|---|
| Heatmap | X |
| Conditionals | C |
As well as the standard control flow colours, which depict the type of control flow (call, jump, ret, external, none-new, none-old or exception), other renderings can be chosen:
Heatmap
The heatmap can show areas of high activity in a large plot
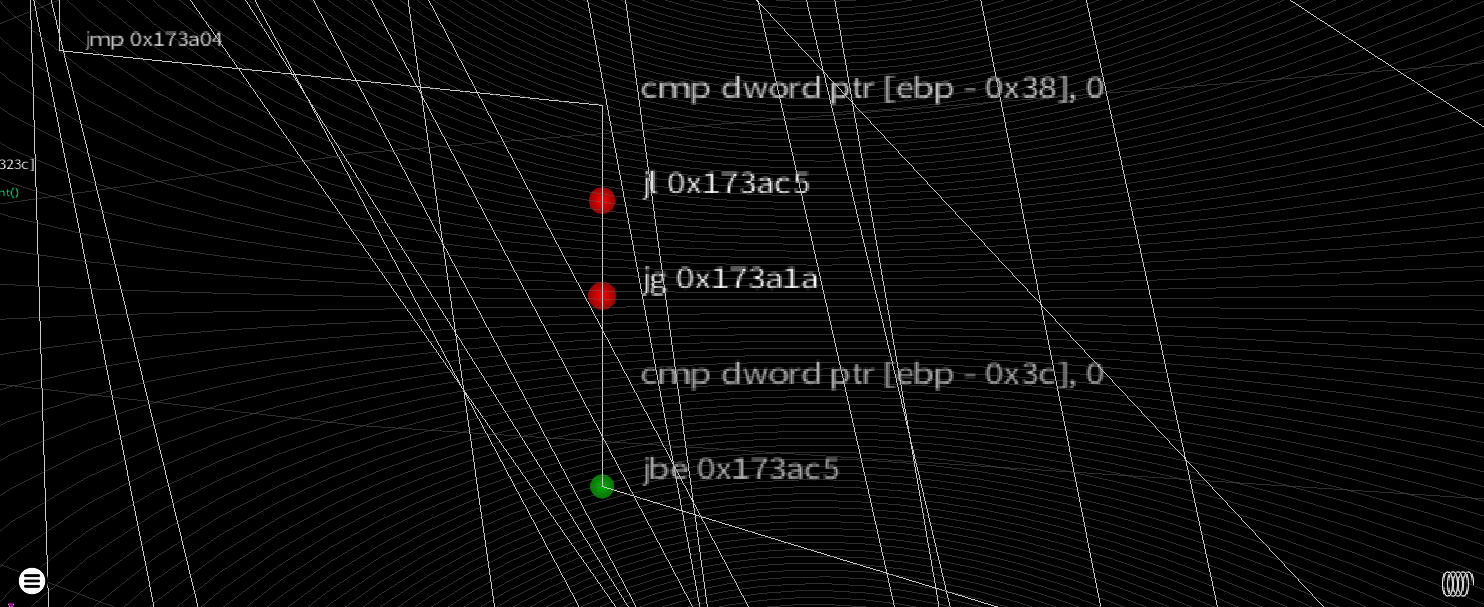
Conditionals
The conditionals render offers a quick way to see if a conditional jump as always been taken, never been taken or fully explored.
Degree
The degree plot shows how connected nodes are using heatmap colouration. Nodes above the clump limit have their own colour, which shows the nodes affected by the clumping multiplier in the force directed layout settings.