
Menu - Top Row
The top row contains standard menu actions
- Target
- Select Target Executable - Open a file dialog to choose a new binary target to load
- Recent Binaries - Choose from a list of recent loaded targets
- Open Saved Trace - Open a file dialog to choose a previously loaded binary target to load
- Recent Traces - Choose from a list of recent saved/opened traces
- Save Trace - Save the active trace (ie: all the graphs of the process being viewed in the visualiser) to the traces directory
- Save Target - Save all the generated traces of the active target (selected in the target bar)
- Save All - Save all of the generated traces for all loaded targets
- Export Pajek - Save the active graph (the one in the main visualiser window) in Pajek format. This can be loaded into other graph visualisation tools.
- Open Screenshot/Video Folder - Open a file manager window to the screenshot/video capture directory
- Exit - Close rgat
-
Settings - Opens the Settings Dialog
- Remote Tracing - Shows the state of the connection and opens the Remote Tracing dialog when clicked.
![]() Targets will be executed on the current machine
Targets will be executed on the current machine
![]() Targets will be executed remotely
Targets will be executed remotely
- Screenshot Icon
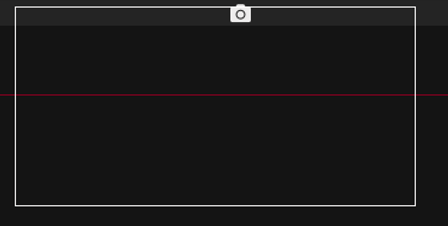
When the image capture keybind is activated (Maingraph, Maingraph+Previews or Whole UI) an animated bounding box showing the area captured will collapse to this icon as feedback. The icon will linger for a few seconds and can be clicked to open the folder the image was saved to.
- Recording State

A video icon will show while recording the rgat window via FFmpeg. This icon can be left clicked to open the media directory and right clicked to stop recording.
- Logs The Logs menu entry is where all of rgat’s alerts, errors, logs and debug output is accessed. Unread alerts and errors are shown as a counter and can be previewed by mousing over the entry.
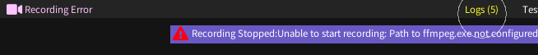
An error causes an alert box under the log menu entry and an animation to draw the eye
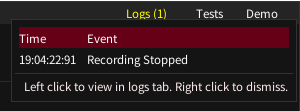
Mousing over the logs icon with one unread alert
Right clicking will clear the alerts. Left clicking will open the Logs dialog.
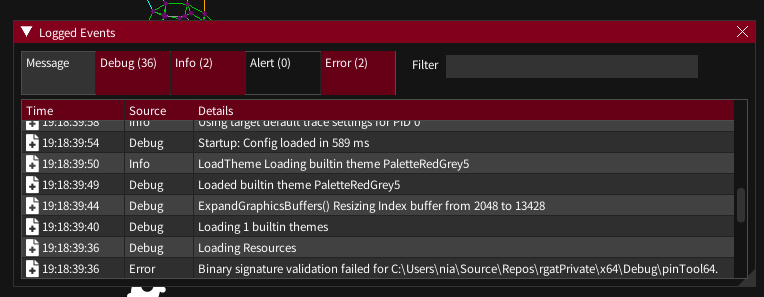
The filterable logs dialog accessed from the logs menu item
-
Tests - Access to the test harness. Must be enabled in Settings->Miscellaneous
-
Demo - Access to the ImGui demo dialog, which may be useful for UI testing and development. Must be enabled in Settings->Miscellaneous. In future this may be unavailable in release builds.
Target Bar (Middle row)
The targets dropdown can be used to set switch between loaded target binaries to set the active target.
Not available on the splash screen
Tabs (Base Row)
Select the workspace
- Start Trace - Configure/Launch the active target
- Visualiser - View running/collected traces
- Analysis - View API information for gathered traces
Not available on the splash screen